Nokia 2009 Annual Report Download - page 179
Download and view the complete annual report
Please find page 179 of the 2009 Nokia annual report below. You can navigate through the pages in the report by either clicking on the pages listed below, or by using the keyword search tool below to find specific information within the annual report.-
 1
1 -
2
-
3
-
4
-
5
-
6
-
7
-
8
-
9
-
10
-
11
-
12
-
13
-
14
-
15
-
16
-
17
-
18
-
19
-
20
-
21
-
22
-
23
-
24
-
25
-
26
-
27
-
28
-
29
-
30
-
31
-
32
-
33
-
34
-
35
-
36
-
37
-
38
-
39
-
40
-
41
-
42
-
43
-
44
-
45
-
46
-
47
-
48
-
49
-
50
-
51
-
52
-
53
-
54
-
55
-
56
-
57
-
58
-
59
-
60
-
61
-
62
-
63
-
64
-
65
-
66
-
67
-
68
-
69
-
70
-
71
-
72
-
73
-
74
-
75
-
76
-
77
-
78
-
79
-
80
-
81
-
82
-
83
-
84
-
85
-
86
-
87
-
88
-
89
-
90
-
91
-
92
-
93
-
94
-
95
-
96
-
97
-
98
-
99
-
100
-
101
-
102
-
103
-
104
-
105
-
106
-
107
-
108
-
109
-
110
-
111
-
112
-
113
-
114
-
115
-
116
-
117
-
118
-
119
-
120
-
121
-
122
-
123
-
124
-
125
-
126
-
127
-
128
-
129
-
130
-
131
-
132
-
133
-
134
-
135
-
136
-
137
-
138
-
139
-
140
-
141
-
142
-
143
-
144
-
145
-
146
-
147
-
148
-
149
-
150
-
151
-
152
-
153
-
154
-
155
-
156
-
157
-
158
-
159
-
160
-
161
-
162
-
163
-
164
-
165
-
166
-
167
-
168
-
 169
169 -
 170
170 -
 171
171 -
 172
172 -
 173
173 -
 174
174 -
 175
175 -
 176
176 -
 177
177 -
 178
178 -
 179
179 -
 180
180 -
 181
181 -
 182
182 -
 183
183 -
 184
184 -
 185
185 -
 186
186 -
 187
187 -
 188
188 -
 189
189 -
190
-
191
-
192
-
193
-
194
-
195
-
196
-
197
-
198
-
199
-
200
-
201
-
202
-
203
-
204
-
205
-
206
-
207
-
208
-
209
-
210
-
211
-
212
-
213
-
214
-
215
-
216
-
217
-
218
-
219
-
220
-
221
-
222
-
223
-
224
-
225
-
226
-
227
-
228
-
229
-
230
-
231
-
232
-
233
-
234
-
235
-
236
-
237
-
238
-
239
-
240
-
241
-
242
-
243
-
244
-
245
-
246
-
247
-
248
-
249
-
250
-
251
-
252
-
253
-
254
-
255
-
256
-
257
-
258
-
259
-
260
-
261
-
262
-
263
-
264
 |
 |

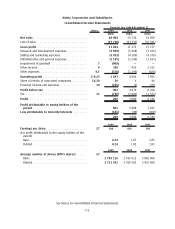
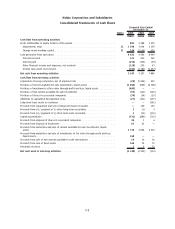
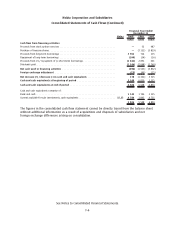
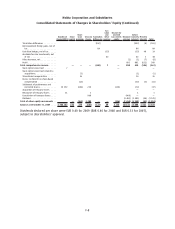
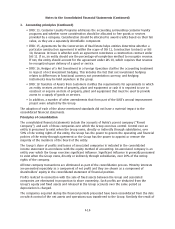
Nokia Corporation and Subsidiaries
Consolidated Statements of Cash Flows
Notes 2009 2008 2007
Financial Year Ended
December 31
EURm EURm EURm
Cash flow from operating activities
Profit attributable to equity holders of the parent . ............................ 891 3 988 7 205
Adjustments, total. . ................................................ 31 3 390 3 024 1 159
Change in net working capital . . . ...................................... 31 140 (2 546) 605
Cash generated from operations . . . ...................................... 4 421 4 466 8 969
Interest received . . . ................................................ 125 416 362
Interest paid ..................................................... (256) (155) (59)
Other financial income and expenses, net received ........................... (128) 250 67
Income taxes paid, net received . . ...................................... (915) (1 780) (1 457)
Net cash from operating activities ...................................... 3 247 3 197 7 882
Cash flow from investing activities
Acquisition of Group companies, net of acquired cash . . . ....................... (29) (5 962) 253
Purchase of current availableforsale investments, liquid assets . .................. (2 800) (669) (4 798)
Purchase of investments at fair value through profit and loss, liquid assets . . . ........ (695) ——
Purchase of noncurrent availableforsale investments . . ....................... (95) (121) (126)
Purchase of shares in associated companies ................................. (30) (24) (25)
Additions to capitalized development costs . ................................. (27) (131) (157)
Longterm loans made to customers ...................................... —— (261)
Proceeds from repayment and sale of longterm loans receivable .................. —129 163
Proceeds from (+) / payment of () other longterm receivables . . .................. 2(1) 5
Proceeds from (+) / payment of () shortterm loans receivable . . .................. 2(15) (119)
Capital expenditures . . ................................................ (531) (889) (715)
Proceeds from disposal of shares in associated companies ....................... 40 36
Proceeds from disposal of businesses ...................................... 61 41 —
Proceeds from maturities and sale of current availableforsale investments, liquid
assets .......................................................... 1 730 4 664 4 930
Proceeds from maturities and sale of investments at fair value through profit and loss,
liquid assets . ..................................................... 108 ——
Proceeds from sale of noncurrent availableforsale investments .................. 14 10 50
Proceeds from sale of fixed assets . . ...................................... 100 54 72
Dividends received . . . ................................................ 2612
Net cash used in investing activities..................................... (2 148) (2 905) (710)
F5