Nokia 2009 Annual Report Download - page 148
Download and view the complete annual report
Please find page 148 of the 2009 Nokia annual report below. You can navigate through the pages in the report by either clicking on the pages listed below, or by using the keyword search tool below to find specific information within the annual report.-
 1
1 -
2
-
3
-
4
-
5
-
6
-
7
-
8
-
9
-
10
-
11
-
12
-
13
-
14
-
15
-
16
-
17
-
18
-
19
-
20
-
21
-
22
-
23
-
24
-
25
-
26
-
27
-
28
-
29
-
30
-
31
-
32
-
33
-
34
-
35
-
36
-
37
-
38
-
39
-
40
-
41
-
42
-
43
-
44
-
45
-
46
-
47
-
48
-
49
-
50
-
51
-
52
-
53
-
54
-
55
-
56
-
57
-
58
-
59
-
60
-
61
-
62
-
63
-
64
-
65
-
66
-
67
-
68
-
69
-
70
-
71
-
72
-
73
-
74
-
75
-
76
-
77
-
78
-
79
-
80
-
81
-
82
-
83
-
84
-
85
-
86
-
87
-
88
-
89
-
90
-
91
-
92
-
93
-
94
-
95
-
96
-
97
-
98
-
99
-
100
-
101
-
102
-
103
-
104
-
105
-
106
-
107
-
108
-
109
-
110
-
111
-
112
-
113
-
114
-
115
-
116
-
117
-
118
-
119
-
120
-
121
-
122
-
123
-
124
-
125
-
126
-
127
-
128
-
129
-
130
-
131
-
132
-
133
-
134
-
135
-
136
-
137
-
 138
138 -
 139
139 -
 140
140 -
 141
141 -
 142
142 -
 143
143 -
 144
144 -
 145
145 -
 146
146 -
 147
147 -
 148
148 -
 149
149 -
 150
150 -
 151
151 -
 152
152 -
 153
153 -
 154
154 -
 155
155 -
 156
156 -
 157
157 -
 158
158 -
159
-
160
-
161
-
162
-
163
-
164
-
165
-
166
-
167
-
168
-
169
-
170
-
171
-
172
-
173
-
174
-
175
-
176
-
177
-
178
-
179
-
180
-
181
-
182
-
183
-
184
-
185
-
186
-
187
-
188
-
189
-
190
-
191
-
192
-
193
-
194
-
195
-
196
-
197
-
198
-
199
-
200
-
201
-
202
-
203
-
204
-
205
-
206
-
207
-
208
-
209
-
210
-
211
-
212
-
213
-
214
-
215
-
216
-
217
-
218
-
219
-
220
-
221
-
222
-
223
-
224
-
225
-
226
-
227
-
228
-
229
-
230
-
231
-
232
-
233
-
234
-
235
-
236
-
237
-
238
-
239
-
240
-
241
-
242
-
243
-
244
-
245
-
246
-
247
-
248
-
249
-
250
-
251
-
252
-
253
-
254
-
255
-
256
-
257
-
258
-
259
-
260
-
261
-
262
-
263
-
264
 |
 |

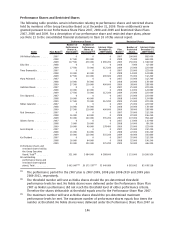
Performance Shares and Restricted Shares
The following table provides certain information relating to performance shares and restricted shares
held by members of the Group Executive Board as at December 31, 2009. These entitlements were
granted pursuant to our Performance Share Plans 2007, 2008 and 2009 and Restricted Share Plans
2007, 2008 and 2009. For a description of our performance share and restricted share plans, please
see Note 23 to the consolidated financial statements in Item 18 of this annual report.
Name Plan Name
(1)
Number of
Performance
Shares at
Threshold
(2)
Number of
Performance
Shares at
Maximum
(3)(4)
Intrinsic Value
December 31,
2009
(4)
(EUR)
Plan
Name
(5)
Number of
Restricted
Shares
Intrinsic Value
December 31,
2009
(6)
(EUR)
Performance Shares Restricted Shares
OlliPekka Kallasvuo ..... 2007 0 0 0 2007 100 000 892 000
2008 57 500 230 000 0 2008 75 000 669 000
2009 117 500 470 000 2 096 200 2009 150 000 1 338 000
EskoAho............. 2008 0 0 0 2008 7 000 62 440
2009 17 500 70 000 312 200 2009 25 000 223 000
Timo Ihamuotila ........ 2007 0 0 0 2007 25 000 223 000
2008 10 000 40 000 0 2008 14 000 124 880
2009 27 500 110 000 490 600 2009 35 000 312 200
Mary McDowell ......... 2007 0 0 0 2007 35 000 312 200
2008 14 000 56 000 0 2008 20 000 178 400
2009 27 500 110 000 490 600 2009 38 000 338 960
Hallstein Moerk......... 2007 0 0 0 2007 25 000 223 000
2008 10 000 40 000 0 2008 14 000 124 880
2009 17 500 70 000 312 200 2009 25 000 223 000
Tero Ojanpera
¨.......... 2007 0 0 0 2007 25 000 223 000
2008 10 000 40 000 0 2008 14 000 124 880
2009 17 500 70 000 312 200 2009 25 000 223 000
Niklas Savander ........ 2007 0 0 0 2007 25 000 223 000
2008 14 000 56 000 0 2008 20 000 178 400
2009 27 500 110 000 490 600 2009 38 000 338 960
Rick Simonson ......... 2007 0 0 0 2007 35 000 312 200
2008 16 000 64 000 0 2008 22 000 196 240
2009 30 000 120 000 535 200 2009 107 000 954 440
Alberto Torres ......... 2007 0 0 0 2007 13 000 115 960
2008 5 000 20 000 0 2008 10 000 89 200
2009 10 000 40 000 178 400 2009 25 000 223 000
Anssi Vanjoki .......... 2007 0 0 0 2007 35 000 312 200
2008 16 000 64 000 0 2008 22 000 196 240
2009 30 000 120 000 535 200 2009 40 000 356 800
Kai O
¨ista
¨mo
¨........... 2007 0 0 0 2007 35 000 312 200
2008 16 000 64 000 0 2008 22 000 196 240
2009 30 000 120 000 535 200 2009 50 000 446 000
Performance shares and
restricted shares held by
the Group Executive
Board, Total
(7)
........ 521000 2084000 6288600 1151000 10266920
All outstanding
performance shares and
restricted shares (global
plans), Total ......... 5093960
(11)
20 375 720
(12)
52 040 089 9 381 002 83 678 538
(1)
The performance period for the 2007 plan is 20072009, 2008 plan 20082010 and 2009 plan
20092011, respectively.
(2)
The threshold number will vest as Nokia shares should the predetermined threshold
performance levels be met. No Nokia shares were delivered under the Performance Share Plan
2007 as Nokia’s performance did not reach the threshold level of either performance criteria.
Therefore the shares deliverable at threshold equals zero for the Performance Share Plan 2007.
(3)
The maximum number will vest as Nokia shares should the predetermined maximum
performance levels be met. The maximum number of performance shares equals four times the
number at threshold. No Nokia shares were delivered under the Performance Share Plan 2007 as
146