Nokia 2009 Annual Report Download - page 256
Download and view the complete annual report
Please find page 256 of the 2009 Nokia annual report below. You can navigate through the pages in the report by either clicking on the pages listed below, or by using the keyword search tool below to find specific information within the annual report.-
 1
1 -
2
-
3
-
4
-
5
-
6
-
7
-
8
-
9
-
10
-
11
-
12
-
13
-
14
-
15
-
16
-
17
-
18
-
19
-
20
-
21
-
22
-
23
-
24
-
25
-
26
-
27
-
28
-
29
-
30
-
31
-
32
-
33
-
34
-
35
-
36
-
37
-
38
-
39
-
40
-
41
-
42
-
43
-
44
-
45
-
46
-
47
-
48
-
49
-
50
-
51
-
52
-
53
-
54
-
55
-
56
-
57
-
58
-
59
-
60
-
61
-
62
-
63
-
64
-
65
-
66
-
67
-
68
-
69
-
70
-
71
-
72
-
73
-
74
-
75
-
76
-
77
-
78
-
79
-
80
-
81
-
82
-
83
-
84
-
85
-
86
-
87
-
88
-
89
-
90
-
91
-
92
-
93
-
94
-
95
-
96
-
97
-
98
-
99
-
100
-
101
-
102
-
103
-
104
-
105
-
106
-
107
-
108
-
109
-
110
-
111
-
112
-
113
-
114
-
115
-
116
-
117
-
118
-
119
-
120
-
121
-
122
-
123
-
124
-
125
-
126
-
127
-
128
-
129
-
130
-
131
-
132
-
133
-
134
-
135
-
136
-
137
-
138
-
139
-
140
-
141
-
142
-
143
-
144
-
145
-
146
-
147
-
148
-
149
-
150
-
151
-
152
-
153
-
154
-
155
-
156
-
157
-
158
-
159
-
160
-
161
-
162
-
163
-
164
-
165
-
166
-
167
-
168
-
169
-
170
-
171
-
172
-
173
-
174
-
175
-
176
-
177
-
178
-
179
-
180
-
181
-
182
-
183
-
184
-
185
-
186
-
187
-
188
-
189
-
190
-
191
-
192
-
193
-
194
-
195
-
196
-
197
-
198
-
199
-
200
-
201
-
202
-
203
-
204
-
205
-
206
-
207
-
208
-
209
-
210
-
211
-
212
-
213
-
214
-
215
-
216
-
217
-
218
-
219
-
220
-
221
-
222
-
223
-
224
-
225
-
226
-
227
-
228
-
229
-
230
-
231
-
232
-
233
-
234
-
235
-
236
-
237
-
238
-
239
-
240
-
241
-
242
-
243
-
244
-
245
-
 246
246 -
 247
247 -
 248
248 -
 249
249 -
 250
250 -
 251
251 -
 252
252 -
 253
253 -
 254
254 -
 255
255 -
 256
256 -
 257
257 -
 258
258 -
 259
259 -
 260
260 -
 261
261 -
 262
262 -
 263
263 -
 264
264
 |
 |
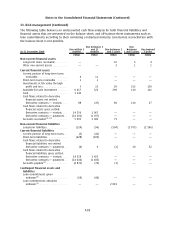
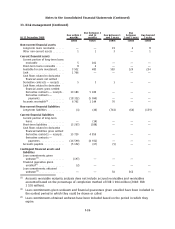
33. Risk management (Continued)
Financial Credit Risk
Financial instruments contain an element of risk of loss resulting from counterparties being unable to
meet their obligations. This risk is measured and monitored centrally by Treasury. Nokia manages
financial credit risk actively by limiting its counterparties to a sufficient number of major banks and
financial institutions and monitoring the credit worthiness and exposure sizes continuously as well as
through entering into netting arrangements (which gives Nokia the right to offset in the event that
the counterparty would not be able to fulfill the obligations) with all major counterparties and
collateral agreements (which require counterparties to post collateral against derivative receivables)
with certain counterparties.
Nokia’s investment decisions are based on strict creditworthiness and maturity criteria as defined in
the Treasury Policy and Operating Procedure. Due to global banking crisis and the freezing of the
credit markets in 2008, Nokia applied an even more defensive approach than usual within Treasury
Policy towards investments and counterparty quality and maturities, focusing on capital preservation
and liquidity. As result of this investment policy approach and active management of outstanding
investment exposures, Nokia has not been subject to any material credit losses in its financial
investments.
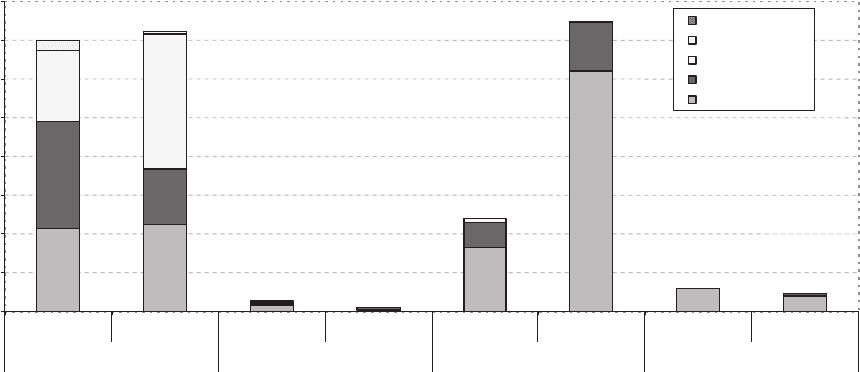
The table below presents the breakdown of the outstanding availableforsale fixed income and money
market investments by sector and credit rating grades ranked as per Moody’s rating categories.
Fixed income and moneymarket investments
(1), (2)
EUR million
0
500
1,000
1,500
2,000
2,500
3,000
3,500
4,000
2008 2009 2008 2009 2008 2009 2008 2009
Banks Corporates Governments ABS
Ba1-B3
Baa1-Baa3
A1-A3
Aa1-Aa3
Aaa
(1)
Fixed income and moneymarket investments include term deposits, investments in liquidity funds and investments in fixed
income instruments classified as availableforsale investments and investments at fair value though profit and loss.
Liquidity funds invested solely in government securities are included under Governments. Other liquidity funds are included
under Banks.
(2)
Included within fixed income and moneymarket investments is EUR 48 million of restricted investment at December 31,
2009 (EUR 114 million at December 31, 2008). They are restricted financial assets under various contractual or legal
obligations.
(3)
Bank parent company ratings used here for bank groups. In some emerging markets countries actual bank subsidiary ratings
may differ from parent company rating.
84% of Nokia’s cash is held with banks of investment grade credit rating (89% for 2008).
F82
Notes to the Consolidated Financial Statements (Continued)