Nokia 2009 Annual Report Download - page 12
Download and view the complete annual report
Please find page 12 of the 2009 Nokia annual report below. You can navigate through the pages in the report by either clicking on the pages listed below, or by using the keyword search tool below to find specific information within the annual report.-
 1
1 -
 2
2 -
 3
3 -
 4
4 -
 5
5 -
 6
6 -
 7
7 -
 8
8 -
 9
9 -
 10
10 -
 11
11 -
 12
12 -
 13
13 -
 14
14 -
 15
15 -
 16
16 -
 17
17 -
 18
18 -
 19
19 -
 20
20 -
 21
21 -
 22
22 -
23
-
24
-
25
-
26
-
27
-
28
-
29
-
30
-
31
-
32
-
33
-
34
-
35
-
36
-
37
-
38
-
39
-
40
-
41
-
42
-
43
-
44
-
45
-
46
-
47
-
48
-
49
-
50
-
51
-
52
-
53
-
54
-
55
-
56
-
57
-
58
-
59
-
60
-
61
-
62
-
63
-
64
-
65
-
66
-
67
-
68
-
69
-
70
-
71
-
72
-
73
-
74
-
75
-
76
-
77
-
78
-
79
-
80
-
81
-
82
-
83
-
84
-
85
-
86
-
87
-
88
-
89
-
90
-
91
-
92
-
93
-
94
-
95
-
96
-
97
-
98
-
99
-
100
-
101
-
102
-
103
-
104
-
105
-
106
-
107
-
108
-
109
-
110
-
111
-
112
-
113
-
114
-
115
-
116
-
117
-
118
-
119
-
120
-
121
-
122
-
123
-
124
-
125
-
126
-
127
-
128
-
129
-
130
-
131
-
132
-
133
-
134
-
135
-
136
-
137
-
138
-
139
-
140
-
141
-
142
-
143
-
144
-
145
-
146
-
147
-
148
-
149
-
150
-
151
-
152
-
153
-
154
-
155
-
156
-
157
-
158
-
159
-
160
-
161
-
162
-
163
-
164
-
165
-
166
-
167
-
168
-
169
-
170
-
171
-
172
-
173
-
174
-
175
-
176
-
177
-
178
-
179
-
180
-
181
-
182
-
183
-
184
-
185
-
186
-
187
-
188
-
189
-
190
-
191
-
192
-
193
-
194
-
195
-
196
-
197
-
198
-
199
-
200
-
201
-
202
-
203
-
204
-
205
-
206
-
207
-
208
-
209
-
210
-
211
-
212
-
213
-
214
-
215
-
216
-
217
-
218
-
219
-
220
-
221
-
222
-
223
-
224
-
225
-
226
-
227
-
228
-
229
-
230
-
231
-
232
-
233
-
234
-
235
-
236
-
237
-
238
-
239
-
240
-
241
-
242
-
243
-
244
-
245
-
246
-
247
-
248
-
249
-
250
-
251
-
252
-
253
-
254
-
255
-
256
-
257
-
258
-
259
-
260
-
261
-
262
-
263
-
264
 |
 |

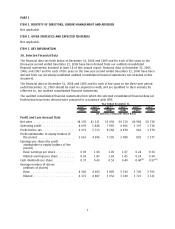
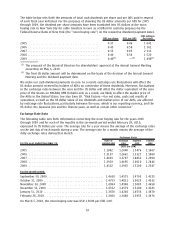
The table below sets forth the amounts of total cash dividends per share and per ADS paid in respect
of each fiscal year indicated. For the purposes of showing the US dollar amounts per ADS for 2005
through 2009, the dividend per share amounts have been translated into US dollars at the noon
buying rate in New York City for cable transfers in euro as certified for customs purposes by the
Federal Reserve Bank of New York (the “noon buying rate”) on the respective dividend payment dates.
EUR per share USD per ADS
EUR millions
(in total)
2005 ............................................. 0.37 0.46 1 641
2006 ............................................. 0.43 0.58 1 761
2007 ............................................. 0.53 0.83 2 111
2008 ............................................. 0.40 0.54 1 520
2009 ............................................. 0.40
(1)
—
(2)
1 498
(1)
(1)
The proposal of the Board of Directors for shareholders’ approval at the Annual General Meeting
convening on May 6, 2010.
(2)
The final US dollar amount will be determined on the basis of the decision of the Annual General
Meeting and the dividend payment date.
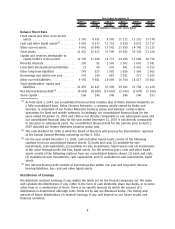
We make our cash dividend payments in euro. As a result, exchange rate fluctuations will affect the
US dollar amount received by holders of ADSs on conversion of these dividends. Moreover, fluctuations
in the exchange rates between the euro and the US dollar will affect the dollar equivalent of the euro
price of the shares on NASDAQ OMX Helsinki and, as a result, are likely to affect the market price of
the ADSs in the United States. See also Item 3D. “Risk Factors—Our net sales, costs and results of
operations, as well as the US dollar value of our dividends and market price of our ADSs, are affected
by exchange rate fluctuations, particularly between the euro, which is our reporting currency, and the
US dollar, the Japanese yen and the Chinese yuan, as well as certain other currencies.”
Exchange Rate Data
The following table sets forth information concerning the noon buying rate for the years 2005
through 2009 and for each of the months in the sixmonth period ended February 28, 2010,
expressed in US dollars per euro. The average rate for a year means the average of the exchange rates
on the last day of each month during a year. The average rate for a month means the average of the
daily exchange rates during that month.
For the year ended December 31:
Rate at
period end
Average
rate
Highest
rate
Lowest
rate
Exchange Rates
(USD per EUR)
2005 ............................................. 1.1842 1.2400 1.3476 1.1667
2006 ............................................. 1.3197 1.2661 1.3327 1.1860
2007 ............................................. 1.4603 1.3797 1.4862 1.2904
2008 ............................................. 1.3919 1.4695 1.6010 1.2446
2009 ............................................. 1.4332 1.3935 1.5100 1.2547
For the month ended:
September 30, 2009 . .................................. 1.4630 1.4575 1.4795 1.4235
October 31, 2009 . . . .................................. 1.4755 1.4821 1.5029 1.4532
November 30, 2009 . .................................. 1.4994 1.4908 1.5085 1.4658
December 31, 2009 . .................................. 1.4332 1.4579 1.5100 1.4243
January 31, 2010 . . . .................................. 1.3870 1.4266 1.4536 1.3870
February 28, 2010 . . .................................. 1.3660 1.3680 1.3955 1.3476
On March 5, 2010, the noon buying rate was USD 1.3608 per EUR 1.00.
10