Nokia 2009 Annual Report Download - page 131
Download and view the complete annual report
Please find page 131 of the 2009 Nokia annual report below. You can navigate through the pages in the report by either clicking on the pages listed below, or by using the keyword search tool below to find specific information within the annual report.-
 1
1 -
2
-
3
-
4
-
5
-
6
-
7
-
8
-
9
-
10
-
11
-
12
-
13
-
14
-
15
-
16
-
17
-
18
-
19
-
20
-
21
-
22
-
23
-
24
-
25
-
26
-
27
-
28
-
29
-
30
-
31
-
32
-
33
-
34
-
35
-
36
-
37
-
38
-
39
-
40
-
41
-
42
-
43
-
44
-
45
-
46
-
47
-
48
-
49
-
50
-
51
-
52
-
53
-
54
-
55
-
56
-
57
-
58
-
59
-
60
-
61
-
62
-
63
-
64
-
65
-
66
-
67
-
68
-
69
-
70
-
71
-
72
-
73
-
74
-
75
-
76
-
77
-
78
-
79
-
80
-
81
-
82
-
83
-
84
-
85
-
86
-
87
-
88
-
89
-
90
-
91
-
92
-
93
-
94
-
95
-
96
-
97
-
98
-
99
-
100
-
101
-
102
-
103
-
104
-
105
-
106
-
107
-
108
-
109
-
110
-
111
-
112
-
113
-
114
-
115
-
116
-
117
-
118
-
119
-
120
-
 121
121 -
 122
122 -
 123
123 -
 124
124 -
 125
125 -
 126
126 -
 127
127 -
 128
128 -
 129
129 -
 130
130 -
 131
131 -
 132
132 -
 133
133 -
 134
134 -
 135
135 -
 136
136 -
 137
137 -
 138
138 -
 139
139 -
 140
140 -
 141
141 -
142
-
143
-
144
-
145
-
146
-
147
-
148
-
149
-
150
-
151
-
152
-
153
-
154
-
155
-
156
-
157
-
158
-
159
-
160
-
161
-
162
-
163
-
164
-
165
-
166
-
167
-
168
-
169
-
170
-
171
-
172
-
173
-
174
-
175
-
176
-
177
-
178
-
179
-
180
-
181
-
182
-
183
-
184
-
185
-
186
-
187
-
188
-
189
-
190
-
191
-
192
-
193
-
194
-
195
-
196
-
197
-
198
-
199
-
200
-
201
-
202
-
203
-
204
-
205
-
206
-
207
-
208
-
209
-
210
-
211
-
212
-
213
-
214
-
215
-
216
-
217
-
218
-
219
-
220
-
221
-
222
-
223
-
224
-
225
-
226
-
227
-
228
-
229
-
230
-
231
-
232
-
233
-
234
-
235
-
236
-
237
-
238
-
239
-
240
-
241
-
242
-
243
-
244
-
245
-
246
-
247
-
248
-
249
-
250
-
251
-
252
-
253
-
254
-
255
-
256
-
257
-
258
-
259
-
260
-
261
-
262
-
263
-
264
 |
 |

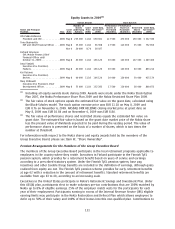
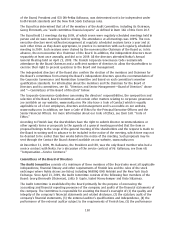
Summary Compensation Table 2009
Name and
Principal
Position
(1)
Year(**) Salary Bonus
(2)
Stock
Awards
(3)
Option
Awards
(3)
NonEquity
Incentive Plan
Compensation
Change in
Pension Value
and Nonqualified
Deferred
Compensation
Earnings
All Other
Compensation Total
EUR EUR EUR EUR EUR EUR EUR EUR
OlliPekka Kallasvuo 2009 1 176 000 1 288 144 3 332 940 650 661 (*) 1 358 429
(4)(5)
177 248
(6)
7 983 422
President and CEO . . . . . . . . . . . . 2008 1 144 800 721 733 2 470 858 548 153 (*) 469 060 175 164 5 529 768
2007 1 037 619 2 348 877 5 709 382 581 690 (*) 956 333 183 603 10 817 504
Timo Ihamuotila
EVP and Chief Financial Officer
(7)
. . . . 2009 396 825 234 286 752 856 135 834 (*) 15 575
(4)
21 195
(7)
1 556 571
Richard Simonson 2009 648 494 453 705 1 449 466 166 126 (*) 134 966
(9)
2 852 757
EVP, Mobile Phones (Chief Financial . . 2008 630 263 293 477 699 952 152 529 (*) 106 632 1 882 853
Officer until October 31, 2009)
(8)
2007 488 422 827 333 1 978 385 199 956 (*) 46 699 3 540 795
Anssi Vanjoki 2009 630 000 342 250 863 212 166 126 (*) 68 541
(4)
31 055
(10)
2 101 184
EVP, Markets . . . . . . . . . . . . . . . . 2008 615 143 260 314 699 952 152 529 (*) — 33 552 1 761 490
2007 556 381 900 499 1 978 385 199 956 (*) 18 521 49 244 3 702 986
Kai O
¨ista
¨mo
¨2009 460 000 343 225 935 174 166 126 (*) 9 824
(4)
29 778
(11)
1 944 127
EVP, Devices . . . . . . . . . . . . . . . . 2008 445 143 200 126 699 952 152 529 (*) 87 922 29 712 1 615 384
2007 382 667 605 520 1 978 385 199 956 (*) 41 465 32 086 3 240 079
Mary McDowell 2009 508 338 349 911 800 873 152 283 (*) 33 726
(12)
1 845 131
EVP, Chief Development Officer
(8)
. . . . 2008 493 798 196 138 620 690 133 463 (*) 33 462 1 477 551
2007 444 139 769 773 1 978 385 199 956 (*) 32 463 3 424 716
(1)
The positions set forth in this table are the current positions of the named executives. Until
October 30, 2009, Mr. Ihamuotila served as Executive Vice President and Global Head of Sales.
Mr. Simonson served as Executive Vice President and Chief Financial Officer until October 30,
2009.
(2)
Bonus payments are part of Nokia’s shortterm cash incentives. The amount consists of the
bonus awarded and paid or payable by Nokia for the respective fiscal year.
(3)
Amounts shown represent the grant date fair value of equity grants awarded in the respective
fiscal year. The fair value of stock options equals the estimated fair value on the grant date,
calculated using the BlackScholes model. The fair value of performance shares and restricted
shares equals the estimated fair value on grant date. The estimated fair value is based on the
grant date market price of the Nokia share less the present value of dividends expected to be
paid during the vesting period. The value of the performance shares is presented on the basis of
a number of shares, which is two times the number of shares at threshold. The value of
restricted shares and performance shares at maximum (four times the number of shares at
threshold), for each of the named executive officer, is as follows: Mr. Kallasvuo EUR 5 586 450;
Mr. Ihamuotila EUR 1 249 720; Mr. Simonson EUR 2 024 831; Mr. Vanjoki EUR 1 438 576; Mr.
O
¨ista
¨mo
¨EUR 1 510 538 and Ms. McDowell EUR 1 328 290.
(4)
The change in pension value represents the proportionate change in the liability related to the
individual executive. These executives are covered by the Finnish State employees’ pension act
(“TyEL”) that provides for a retirement benefit based on years of service and earnings according
to the prescribed statutory system. The TyEL system is a partly funded and a partly pooled “pay
as you go” system. Effective March 1, 2008, Nokia transferred its TyEL pension liability and assets
to an external Finnish insurance company and no longer carries the liability on its financial
statements. The figures shown represent only the change in liability for the funded portion. The
method used to derive the actuarial IFRS valuation is based upon available salary information at
the respective year end. Actuarial assumptions including salary increases and inflation have been
determined to arrive at the valuation at the respective year end.
(5)
The change in pension value for Mr. Kallasvuo includes the reduction of EUR 1 571 for the
proportionate change in the liability related to the individual under the funded part of the
Finnish TyEL pension (see footnote 4 above). In addition, it includes EUR 1 360 000 for the
129