Nokia 2009 Annual Report Download - page 90
Download and view the complete annual report
Please find page 90 of the 2009 Nokia annual report below. You can navigate through the pages in the report by either clicking on the pages listed below, or by using the keyword search tool below to find specific information within the annual report.-
 1
1 -
2
-
3
-
4
-
5
-
6
-
7
-
8
-
9
-
10
-
11
-
12
-
13
-
14
-
15
-
16
-
17
-
18
-
19
-
20
-
21
-
22
-
23
-
24
-
25
-
26
-
27
-
28
-
29
-
30
-
31
-
32
-
33
-
34
-
35
-
36
-
37
-
38
-
39
-
40
-
41
-
42
-
43
-
44
-
45
-
46
-
47
-
48
-
49
-
50
-
51
-
52
-
53
-
54
-
55
-
56
-
57
-
58
-
59
-
60
-
61
-
62
-
63
-
64
-
65
-
66
-
67
-
68
-
69
-
70
-
71
-
72
-
73
-
74
-
75
-
76
-
77
-
78
-
79
-
 80
80 -
 81
81 -
 82
82 -
 83
83 -
 84
84 -
 85
85 -
 86
86 -
 87
87 -
 88
88 -
 89
89 -
 90
90 -
 91
91 -
 92
92 -
 93
93 -
 94
94 -
 95
95 -
 96
96 -
 97
97 -
 98
98 -
 99
99 -
 100
100 -
101
-
102
-
103
-
104
-
105
-
106
-
107
-
108
-
109
-
110
-
111
-
112
-
113
-
114
-
115
-
116
-
117
-
118
-
119
-
120
-
121
-
122
-
123
-
124
-
125
-
126
-
127
-
128
-
129
-
130
-
131
-
132
-
133
-
134
-
135
-
136
-
137
-
138
-
139
-
140
-
141
-
142
-
143
-
144
-
145
-
146
-
147
-
148
-
149
-
150
-
151
-
152
-
153
-
154
-
155
-
156
-
157
-
158
-
159
-
160
-
161
-
162
-
163
-
164
-
165
-
166
-
167
-
168
-
169
-
170
-
171
-
172
-
173
-
174
-
175
-
176
-
177
-
178
-
179
-
180
-
181
-
182
-
183
-
184
-
185
-
186
-
187
-
188
-
189
-
190
-
191
-
192
-
193
-
194
-
195
-
196
-
197
-
198
-
199
-
200
-
201
-
202
-
203
-
204
-
205
-
206
-
207
-
208
-
209
-
210
-
211
-
212
-
213
-
214
-
215
-
216
-
217
-
218
-
219
-
220
-
221
-
222
-
223
-
224
-
225
-
226
-
227
-
228
-
229
-
230
-
231
-
232
-
233
-
234
-
235
-
236
-
237
-
238
-
239
-
240
-
241
-
242
-
243
-
244
-
245
-
246
-
247
-
248
-
249
-
250
-
251
-
252
-
253
-
254
-
255
-
256
-
257
-
258
-
259
-
260
-
261
-
262
-
263
-
264
 |
 |

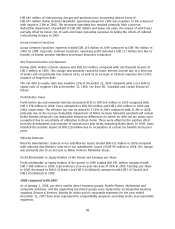
The key assumptions applied in the impairment testing for each CGU in the annual goodwill
impairment testing for each year indicated are presented in the table below:
2009 2008 2009 2008 2009 2008
Nokia Siemens
Networks
%
NAVTEQ
(1)
%
Devices &
Services
(1)
%
Cashgenerating Unit
Terminal growth rate........................ 2.00 2.28 1.00 1.00 5.00 5.00
Pretax discount rate ........................ 11.46 12.35 13.24 15.60 12.60 12.42
(1)
Subsequent to the acquisition of NAVTEQ on July 10, 2008, we have had three operating and
reportable segments: Devices & Services, NAVTEQ and Nokia Siemens Networks. The organizational
changes fundamentally altered our reporting structure, the information reported to management
as well as the way in which management monitors and runs operations and accordingly no
directly comparable information for the Devices & Services CGU and NAVTEQ CGU is available for the
year ended December 31, 2007.
The annual goodwill impairment testing conducted for each of the Group’s CGUs for the years ended
December 31, 2008 and 2007 have not resulted in any impairment charges. The goodwill impairment
testing for the year ended December 31, 2009 resulted in the aforementioned impairment charge for
the Nokia Siemens Networks CGU.
The Group has applied consistent valuation methodologies for each of the Group’s CGUs for the years
ended December 31, 2009, 2008 and 2007. We periodically update the assumptions applied in our
impairment testing to reflect management’s best estimates of future cash flows and the conditions
that are expected to prevail during the forecast period.
See also Note 7 to our consolidated financial statements included in Item 18 of this annual report for
further information regarding “Valuation of longlived and intangible assets and goodwill.”
Fair Value of Derivatives and Other Financial Instruments
The fair value of financial instruments that are not traded in an active market (for example, unlisted
equities, currency options and embedded derivatives) are determined using valuation techniques. We
use judgment to select an appropriate valuation methodology and underlying assumptions based
principally on existing market conditions. If quoted market prices are not available for unlisted
shares, fair value is estimated by using various factors, including, but not limited to: (1) the current
market value of similar instruments, (2) prices established from a recent arm’s length financing
transaction of the target companies, (3) analysis of market prospects and operating performance of
the target companies taking into consideration of public market comparable companies in similar
industry sectors. Changes in these assumptions may cause the Group to recognize impairments or
losses in the future periods. The financial impact of these assumptions mainly affects Devices &
Services segment.
Income Taxes
The Group is subject to income taxes both in Finland and in numerous other jurisdictions. Significant
judgment is required in determining income tax expense, tax provisions, deferred tax assets and
liabilities recognized in the consolidated financial statements. We recognize deferred tax assets to the
extent that it is probable that sufficient taxable income will be available in the future against which
the temporary differences and unused tax losses can be utilized. We have considered future taxable
income and tax planning strategies in making this assessment. If circumstances indicate it is no
longer probable that deferred tax assets will be utilized they are assessed for realizability and
adjusted as necessary. At December 31, 2009, the Group had loss carry forwards and temporary
differences of EUR 2 532 million (EUR 102 million in 2008) for which no deferred tax assets were
88