Nokia 2009 Annual Report Download - page 207
Download and view the complete annual report
Please find page 207 of the 2009 Nokia annual report below. You can navigate through the pages in the report by either clicking on the pages listed below, or by using the keyword search tool below to find specific information within the annual report.-
 1
1 -
2
-
3
-
4
-
5
-
6
-
7
-
8
-
9
-
10
-
11
-
12
-
13
-
14
-
15
-
16
-
17
-
18
-
19
-
20
-
21
-
22
-
23
-
24
-
25
-
26
-
27
-
28
-
29
-
30
-
31
-
32
-
33
-
34
-
35
-
36
-
37
-
38
-
39
-
40
-
41
-
42
-
43
-
44
-
45
-
46
-
47
-
48
-
49
-
50
-
51
-
52
-
53
-
54
-
55
-
56
-
57
-
58
-
59
-
60
-
61
-
62
-
63
-
64
-
65
-
66
-
67
-
68
-
69
-
70
-
71
-
72
-
73
-
74
-
75
-
76
-
77
-
78
-
79
-
80
-
81
-
82
-
83
-
84
-
85
-
86
-
87
-
88
-
89
-
90
-
91
-
92
-
93
-
94
-
95
-
96
-
97
-
98
-
99
-
100
-
101
-
102
-
103
-
104
-
105
-
106
-
107
-
108
-
109
-
110
-
111
-
112
-
113
-
114
-
115
-
116
-
117
-
118
-
119
-
120
-
121
-
122
-
123
-
124
-
125
-
126
-
127
-
128
-
129
-
130
-
131
-
132
-
133
-
134
-
135
-
136
-
137
-
138
-
139
-
140
-
141
-
142
-
143
-
144
-
145
-
146
-
147
-
148
-
149
-
150
-
151
-
152
-
153
-
154
-
155
-
156
-
157
-
158
-
159
-
160
-
161
-
162
-
163
-
164
-
165
-
166
-
167
-
168
-
169
-
170
-
171
-
172
-
173
-
174
-
175
-
176
-
177
-
178
-
179
-
180
-
181
-
182
-
183
-
184
-
185
-
186
-
187
-
188
-
189
-
190
-
191
-
192
-
193
-
194
-
195
-
196
-
 197
197 -
 198
198 -
 199
199 -
 200
200 -
 201
201 -
 202
202 -
 203
203 -
 204
204 -
 205
205 -
 206
206 -
 207
207 -
 208
208 -
 209
209 -
 210
210 -
 211
211 -
 212
212 -
 213
213 -
 214
214 -
 215
215 -
 216
216 -
 217
217 -
218
-
219
-
220
-
221
-
222
-
223
-
224
-
225
-
226
-
227
-
228
-
229
-
230
-
231
-
232
-
233
-
234
-
235
-
236
-
237
-
238
-
239
-
240
-
241
-
242
-
243
-
244
-
245
-
246
-
247
-
248
-
249
-
250
-
251
-
252
-
253
-
254
-
255
-
256
-
257
-
258
-
259
-
260
-
261
-
262
-
263
-
264
 |
 |

6. Other operating income and expenses (Continued)
operating profit and EUR 53 million in Nokia Siemens Networks’ operating profit. In addition, a gain
on business transfer EUR 53 million impacted Common functions’ operating profit. In 2007, other
operating expenses includes EUR 58 million in charges related to restructuring costs in Nokia Siemens
Networks. Devices & Services recorded a charge of EUR 17 million for personnel expenses and other
costs as a result of more focused R&D. Devices & Services also recorded restructuring costs of
EUR 35 million primarily related to restructuring of a subsidiary company.
In all three years presented, “Other operating income and expenses” include the costs of hedging
highly probable forecasted sales and purchases (forward points of cash flow hedges). As from 2009,
on the same line are included also the fair value changes of derivatives hedging identifiable and
probable forecasted cash flows.
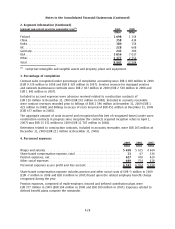
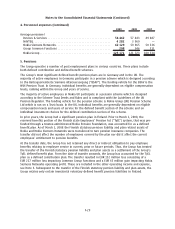
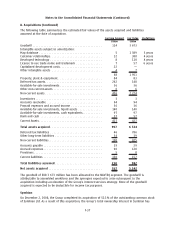
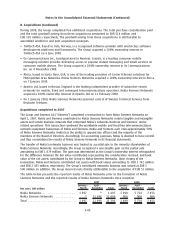
7. Impairment
2009 2008 2007
EURm EURm EURm
Capitalized development costs ....................................... — — 27
Goodwill ......................................................... 908 ——
Other intangible assets ............................................. 56 ——
Property, plant and equipment ....................................... 177 —
Inventories ....................................................... — 13 —
Investments in associated companies .................................. 19 87
Availableforsale investments ........................................ 25 43 29
Other noncurrent assets ............................................ — 8 —
Total, net ........................................................ 1 009 149 63
Capitalized development costs
In 2009 and 2008, the Group did not recognize any impairment charge on capitalized development
costs. During 2007, Nokia Siemens Networks recorded an impairment charge on capitalized
development costs of EUR 27 million. The impairment loss was determined as the full carrying
amount of the capitalized development programs costs related to products that will not be included
in future product portfolios. This impairment amount is included within research and development
expenses in the consolidated income statement.
Goodwill
Goodwill is allocated to the Group’s cashgenerating units (CGU) for the purpose of impairment
testing. The allocation is made to those cashgenerating units that are expected to benefit from the
synergies of the business combination in which the goodwill arose. The Group has allocated goodwill
to three cashgenerating units, which correspond to the Group’s operating and reportable segments:
Devices & Services CGU, Nokia Siemens Networks CGU and NAVTEQ CGU.
The recoverable amounts for the Devices & Services CGU and the NAVTEQ CGU are based on value in
use calculations. The cash flow projections employed in the value in use calculation are based on
financial plans approved by management. These projections are consistent with external sources of
information, wherever available. Cash flows beyond the explicit forecast period are extrapolated using
an estimated terminal growth rate that does not exceed the longterm average growth rates for the
industry and economies in which the CGU operates.
F33
Notes to the Consolidated Financial Statements (Continued)