Nokia 2009 Annual Report Download - page 177
Download and view the complete annual report
Please find page 177 of the 2009 Nokia annual report below. You can navigate through the pages in the report by either clicking on the pages listed below, or by using the keyword search tool below to find specific information within the annual report.-
 1
1 -
2
-
3
-
4
-
5
-
6
-
7
-
8
-
9
-
10
-
11
-
12
-
13
-
14
-
15
-
16
-
17
-
18
-
19
-
20
-
21
-
22
-
23
-
24
-
25
-
26
-
27
-
28
-
29
-
30
-
31
-
32
-
33
-
34
-
35
-
36
-
37
-
38
-
39
-
40
-
41
-
42
-
43
-
44
-
45
-
46
-
47
-
48
-
49
-
50
-
51
-
52
-
53
-
54
-
55
-
56
-
57
-
58
-
59
-
60
-
61
-
62
-
63
-
64
-
65
-
66
-
67
-
68
-
69
-
70
-
71
-
72
-
73
-
74
-
75
-
76
-
77
-
78
-
79
-
80
-
81
-
82
-
83
-
84
-
85
-
86
-
87
-
88
-
89
-
90
-
91
-
92
-
93
-
94
-
95
-
96
-
97
-
98
-
99
-
100
-
101
-
102
-
103
-
104
-
105
-
106
-
107
-
108
-
109
-
110
-
111
-
112
-
113
-
114
-
115
-
116
-
117
-
118
-
119
-
120
-
121
-
122
-
123
-
124
-
125
-
126
-
127
-
128
-
129
-
130
-
131
-
132
-
133
-
134
-
135
-
136
-
137
-
138
-
139
-
140
-
141
-
142
-
143
-
144
-
145
-
146
-
147
-
148
-
149
-
150
-
151
-
152
-
153
-
154
-
155
-
156
-
157
-
158
-
159
-
160
-
161
-
162
-
163
-
164
-
165
-
166
-
 167
167 -
 168
168 -
 169
169 -
 170
170 -
 171
171 -
 172
172 -
 173
173 -
 174
174 -
 175
175 -
 176
176 -
 177
177 -
 178
178 -
 179
179 -
 180
180 -
 181
181 -
 182
182 -
 183
183 -
 184
184 -
 185
185 -
 186
186 -
 187
187 -
188
-
189
-
190
-
191
-
192
-
193
-
194
-
195
-
196
-
197
-
198
-
199
-
200
-
201
-
202
-
203
-
204
-
205
-
206
-
207
-
208
-
209
-
210
-
211
-
212
-
213
-
214
-
215
-
216
-
217
-
218
-
219
-
220
-
221
-
222
-
223
-
224
-
225
-
226
-
227
-
228
-
229
-
230
-
231
-
232
-
233
-
234
-
235
-
236
-
237
-
238
-
239
-
240
-
241
-
242
-
243
-
244
-
245
-
246
-
247
-
248
-
249
-
250
-
251
-
252
-
253
-
254
-
255
-
256
-
257
-
258
-
259
-
260
-
261
-
262
-
263
-
264
 |
 |

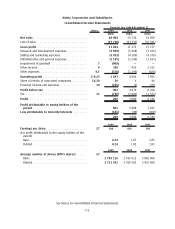
Nokia Corporation and Subsidiaries
Consolidated Statements of Comprehensive Income
Notes 2009 2008 2007
EURm EURm EURm
Financial Year Ended December 31
Profit ........................................... 260 3 889 6 746
Other comprehensive income
Translation differences. . . . . . . . . . . . . . . . . . . . . . . . . . . . . . . 21 (563) 595 (151)
Net investment hedge gains (losses) . . . . . . . . . . . . . . . . . . . . 21 114 (123) 51
Cash flow hedges . . . . . . . . . . . . . . . . . . . . . . . . . . . . . . . . . . 20 25 (40) (7)
Availableforsale investments . . . . . . . . . . . . . . . . . . . . . . . . . 20 48 (15) 49
Other increase (decrease), net . . . . . . . . . . . . . . . . . . . . . . . . . (7) 28 (46)
Income tax related to components of other comprehensive
income......................................... 20,21 (44) 58 (12)
Other comprehensive income (expense), net of tax ...... (427) 503 (116)
Total comprehensive income (expense)................ (167) 4 392 6 630
Total comprehensive income (expense) attributable to
equity holders of the parent . . . . . . . . . . . . . . . . . . . . . . . . 429 4 577 7 073
minority interests . . . . . . . . . . . . . . . . . . . . . . . . . . . . . . . . (596) (185) (443)
(167) 4 392 6 630
See Notes to Consolidated Financial Statements.
F3