Nokia 2009 Annual Report Download - page 237
Download and view the complete annual report
Please find page 237 of the 2009 Nokia annual report below. You can navigate through the pages in the report by either clicking on the pages listed below, or by using the keyword search tool below to find specific information within the annual report.-
 1
1 -
2
-
3
-
4
-
5
-
6
-
7
-
8
-
9
-
10
-
11
-
12
-
13
-
14
-
15
-
16
-
17
-
18
-
19
-
20
-
21
-
22
-
23
-
24
-
25
-
26
-
27
-
28
-
29
-
30
-
31
-
32
-
33
-
34
-
35
-
36
-
37
-
38
-
39
-
40
-
41
-
42
-
43
-
44
-
45
-
46
-
47
-
48
-
49
-
50
-
51
-
52
-
53
-
54
-
55
-
56
-
57
-
58
-
59
-
60
-
61
-
62
-
63
-
64
-
65
-
66
-
67
-
68
-
69
-
70
-
71
-
72
-
73
-
74
-
75
-
76
-
77
-
78
-
79
-
80
-
81
-
82
-
83
-
84
-
85
-
86
-
87
-
88
-
89
-
90
-
91
-
92
-
93
-
94
-
95
-
96
-
97
-
98
-
99
-
100
-
101
-
102
-
103
-
104
-
105
-
106
-
107
-
108
-
109
-
110
-
111
-
112
-
113
-
114
-
115
-
116
-
117
-
118
-
119
-
120
-
121
-
122
-
123
-
124
-
125
-
126
-
127
-
128
-
129
-
130
-
131
-
132
-
133
-
134
-
135
-
136
-
137
-
138
-
139
-
140
-
141
-
142
-
143
-
144
-
145
-
146
-
147
-
148
-
149
-
150
-
151
-
152
-
153
-
154
-
155
-
156
-
157
-
158
-
159
-
160
-
161
-
162
-
163
-
164
-
165
-
166
-
167
-
168
-
169
-
170
-
171
-
172
-
173
-
174
-
175
-
176
-
177
-
178
-
179
-
180
-
181
-
182
-
183
-
184
-
185
-
186
-
187
-
188
-
189
-
190
-
191
-
192
-
193
-
194
-
195
-
196
-
197
-
198
-
199
-
200
-
201
-
202
-
203
-
204
-
205
-
206
-
207
-
208
-
209
-
210
-
211
-
212
-
213
-
214
-
215
-
216
-
217
-
218
-
219
-
220
-
221
-
222
-
223
-
224
-
225
-
226
-
 227
227 -
 228
228 -
 229
229 -
 230
230 -
 231
231 -
 232
232 -
 233
233 -
 234
234 -
 235
235 -
 236
236 -
 237
237 -
 238
238 -
 239
239 -
 240
240 -
 241
241 -
 242
242 -
 243
243 -
 244
244 -
 245
245 -
 246
246 -
 247
247 -
248
-
249
-
250
-
251
-
252
-
253
-
254
-
255
-
256
-
257
-
258
-
259
-
260
-
261
-
262
-
263
-
264
 |
 |

23. Sharebased payment (Continued)
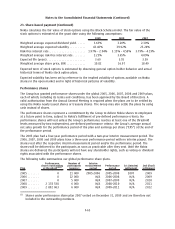
Nokia calculates the fair value of stock options using the BlackScholes model. The fair value of the
stock options is estimated at the grant date using the following assumptions:
2009 2008 2007
Weighted average expected dividend yield ...... 3.63% 3.20% 2.30%
Weighted average expected volatility .......... 43.46% 39.92% 25.24%
Riskfree interest rate ....................... 1.97% 2.94% 3.15% 4.58% 3.79% 4.19%
Weighted average riskfree interest rate ........ 2.23% 3.65% 4.09%
Expected life (years) ........................ 3.60 3.55 3.59
Weighted average share price, EUR ............ 10.82 16.97 18.49
Expected term of stock options is estimated by observing general option holder behavior and actual
historical terms of Nokia stock option plans.
Expected volatility has been set by reference to the implied volatility of options available on Nokia
shares in the open market and in light of historical patterns of volatility.
Performance shares
The Group has granted performance shares under the global 2005, 2006, 2007, 2008 and 2009 plans,
each of which, including its terms and conditions, has been approved by the Board of Directors. A
valid authorization from the Annual General Meeting is required when the plans are to be settled by
using the Nokia newly issued shares or treasury shares. The Group may also settle the plans by using
cash instead of shares.
The performance shares represent a commitment by the Group to deliver Nokia shares to employees
at a future point in time, subject to Nokia’s fulfillment of predefined performance criteria. No
performance shares will vest unless the Group’s performance reaches at least one of the threshold
levels measured by two independent, predefined performance criteria: the Group’s average annual
net sales growth for the performance period of the plan and earnings per share (“EPS”) at the end of
the performance period.
The 2005 plan had a fouryear performance period with a twoyear interim measurement period. The
2006, 2007, 2008 and 2009 plans have a threeyear performance period with no interim payout. The
shares vest after the respective interim measurement period and/or the performance period. The
shares will be delivered to the participants as soon as practicable after they vest. Until the Nokia
shares are delivered, the participants will not have any shareholder rights, such as voting or dividend
rights associated with the performance shares.
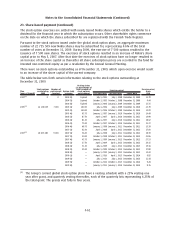
The following table summarizes our global performance share plans.
Plan
Performance
shares outstanding
at threshold
(1)(2)
Number of
participants
(approx.)
Interim
measurement
period
Performance
period
1st (interim)
settlement
2nd (final)
settlement
2005 ....... 0 11000 20052006 20052008 2007 2009
2006 ....... 0 12000 N/A 20062008 N/A 2009
2007 ....... 0 5000 N/A 20072009 N/A 2010
2008 ....... 2178538 6000 N/A 20082010 N/A 2011
2009 ....... 2892063 6000 N/A 20092011 N/A 2012
(1)
Shares under performance share plan 2007 vested on December 31, 2009 and are therefore not
included in the outstanding numbers.
F63
Notes to the Consolidated Financial Statements (Continued)