Nokia 2009 Annual Report Download - page 107
Download and view the complete annual report
Please find page 107 of the 2009 Nokia annual report below. You can navigate through the pages in the report by either clicking on the pages listed below, or by using the keyword search tool below to find specific information within the annual report.-
 1
1 -
2
-
3
-
4
-
5
-
6
-
7
-
8
-
9
-
10
-
11
-
12
-
13
-
14
-
15
-
16
-
17
-
18
-
19
-
20
-
21
-
22
-
23
-
24
-
25
-
26
-
27
-
28
-
29
-
30
-
31
-
32
-
33
-
34
-
35
-
36
-
37
-
38
-
39
-
40
-
41
-
42
-
43
-
44
-
45
-
46
-
47
-
48
-
49
-
50
-
51
-
52
-
53
-
54
-
55
-
56
-
57
-
58
-
59
-
60
-
61
-
62
-
63
-
64
-
65
-
66
-
67
-
68
-
69
-
70
-
71
-
72
-
73
-
74
-
75
-
76
-
77
-
78
-
79
-
80
-
81
-
82
-
83
-
84
-
85
-
86
-
87
-
88
-
89
-
90
-
91
-
92
-
93
-
94
-
95
-
96
-
 97
97 -
 98
98 -
 99
99 -
 100
100 -
 101
101 -
 102
102 -
 103
103 -
 104
104 -
 105
105 -
 106
106 -
 107
107 -
 108
108 -
 109
109 -
 110
110 -
 111
111 -
 112
112 -
 113
113 -
 114
114 -
 115
115 -
 116
116 -
 117
117 -
118
-
119
-
120
-
121
-
122
-
123
-
124
-
125
-
126
-
127
-
128
-
129
-
130
-
131
-
132
-
133
-
134
-
135
-
136
-
137
-
138
-
139
-
140
-
141
-
142
-
143
-
144
-
145
-
146
-
147
-
148
-
149
-
150
-
151
-
152
-
153
-
154
-
155
-
156
-
157
-
158
-
159
-
160
-
161
-
162
-
163
-
164
-
165
-
166
-
167
-
168
-
169
-
170
-
171
-
172
-
173
-
174
-
175
-
176
-
177
-
178
-
179
-
180
-
181
-
182
-
183
-
184
-
185
-
186
-
187
-
188
-
189
-
190
-
191
-
192
-
193
-
194
-
195
-
196
-
197
-
198
-
199
-
200
-
201
-
202
-
203
-
204
-
205
-
206
-
207
-
208
-
209
-
210
-
211
-
212
-
213
-
214
-
215
-
216
-
217
-
218
-
219
-
220
-
221
-
222
-
223
-
224
-
225
-
226
-
227
-
228
-
229
-
230
-
231
-
232
-
233
-
234
-
235
-
236
-
237
-
238
-
239
-
240
-
241
-
242
-
243
-
244
-
245
-
246
-
247
-
248
-
249
-
250
-
251
-
252
-
253
-
254
-
255
-
256
-
257
-
258
-
259
-
260
-
261
-
262
-
263
-
264
 |
 |

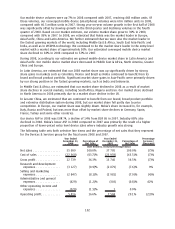
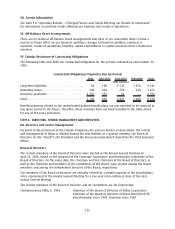
The following table sets forth selective line items and the percentage of net sales that they represent
for Nokia Siemens Networks for the fiscal years 2008 and 2007.
Year Ended
December 31,
2008
Percentage of
Net Sales
Year Ended
December 31,
2007
Percentage of
Net Sales
Percentage
Increase/
(Decrease)
(EUR millions, except percentage data)
Net sales ................. 15309 100.0% 13 393 100.0% 14%
Cost of Sales .............. (10993) (71.8)% (9 876) (73.7)% 11%
Gross profit ............... 4316 28.2% 3 517 26.3% 23%
Research and development
expenses ............... (2500) (16.3)% (2 746) (20.5)% (9.0)%
Selling and marketing
expenses ............... (1421) (9.3)% (1 394) (10.4)% 2%
Administrative and general
expenses ............... (689) (4.5)% (701) (5.2)% (2)%
Other income and expenses . . (7) (0.0)% 16 0.1%
Operating profit............ (301) (2.0)% (1 308) (9.8)% 77%
Nokia Siemens Networks’ net sales in 2008 increased 14% to EUR 15 309 million compared with
EUR 13 393 million in 2007. The increased net sales were primarily due to the fact that the results of
Nokia Siemens Networks from January 1, 2007 to March 31, 2007 included our former Networks
business group only and the challenges related to the start of the operations of Nokia Siemens
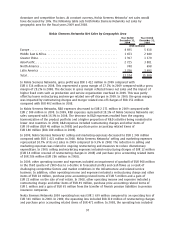
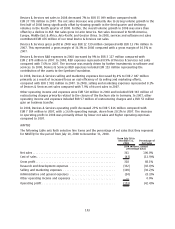
Networks in 2007. The following table sets forth Nokia Siemens Networks net sales by geographic
area for the fiscal years 2008 and 2007.
Nokia Siemens Networks Net Sales by Geographic Area
Year Ended
December 31,
2008
Year Ended
December 31,
2007
(EUR millions)
Europe ...................................................... 5618 5359
Middle East & Africa............................................ 2040 1515
Greater China ................................................. 1379 1350
AsiaPacific................................................... 3881 3350
North America ................................................ 698 616
Latin America ................................................ 1693 1202
Total........................................................ 15309 13393
In Nokia Siemens Networks, gross profit was EUR 4 316 million in 2008 compared with
EUR 3 517 million in 2007. This represented a gross margin of 28.2% in 2008 compared with a gross
margin of 26.3% in 2007. The increased gross margin was primarily due to achieved purchasing
synergies, improved project management and increased software sales. In 2008, the gross margin
was impacted by restructuring charges and other items of EUR 402 million and in 2007 by
restructuring charges and other expenses arising from the realignment of the product portfolio and
related replacement of discontinued products at customer sites of EUR 309 million and purchase price
accounting related items of EUR 182 million.
In Nokia Siemens Networks, R&D expenses decreased to EUR 2 500 million in 2008 compared with
EUR 2 746 million in 2007. In 2008, R&D expenses represented 16.3% of Nokia Siemens Networks net
sales compared with 20.5% in 2007. The decrease in R&D expenses resulted from the elimination of
overlapping product lines, the consolidation of R&D sites, an increased proportion of R&D activities
105