Nokia 2009 Annual Report Download - page 204
Download and view the complete annual report
Please find page 204 of the 2009 Nokia annual report below. You can navigate through the pages in the report by either clicking on the pages listed below, or by using the keyword search tool below to find specific information within the annual report.-
 1
1 -
2
-
3
-
4
-
5
-
6
-
7
-
8
-
9
-
10
-
11
-
12
-
13
-
14
-
15
-
16
-
17
-
18
-
19
-
20
-
21
-
22
-
23
-
24
-
25
-
26
-
27
-
28
-
29
-
30
-
31
-
32
-
33
-
34
-
35
-
36
-
37
-
38
-
39
-
40
-
41
-
42
-
43
-
44
-
45
-
46
-
47
-
48
-
49
-
50
-
51
-
52
-
53
-
54
-
55
-
56
-
57
-
58
-
59
-
60
-
61
-
62
-
63
-
64
-
65
-
66
-
67
-
68
-
69
-
70
-
71
-
72
-
73
-
74
-
75
-
76
-
77
-
78
-
79
-
80
-
81
-
82
-
83
-
84
-
85
-
86
-
87
-
88
-
89
-
90
-
91
-
92
-
93
-
94
-
95
-
96
-
97
-
98
-
99
-
100
-
101
-
102
-
103
-
104
-
105
-
106
-
107
-
108
-
109
-
110
-
111
-
112
-
113
-
114
-
115
-
116
-
117
-
118
-
119
-
120
-
121
-
122
-
123
-
124
-
125
-
126
-
127
-
128
-
129
-
130
-
131
-
132
-
133
-
134
-
135
-
136
-
137
-
138
-
139
-
140
-
141
-
142
-
143
-
144
-
145
-
146
-
147
-
148
-
149
-
150
-
151
-
152
-
153
-
154
-
155
-
156
-
157
-
158
-
159
-
160
-
161
-
162
-
163
-
164
-
165
-
166
-
167
-
168
-
169
-
170
-
171
-
172
-
173
-
174
-
175
-
176
-
177
-
178
-
179
-
180
-
181
-
182
-
183
-
184
-
185
-
186
-
187
-
188
-
189
-
190
-
191
-
192
-
193
-
 194
194 -
 195
195 -
 196
196 -
 197
197 -
 198
198 -
 199
199 -
 200
200 -
 201
201 -
 202
202 -
 203
203 -
 204
204 -
 205
205 -
 206
206 -
 207
207 -
 208
208 -
 209
209 -
 210
210 -
 211
211 -
 212
212 -
 213
213 -
 214
214 -
215
-
216
-
217
-
218
-
219
-
220
-
221
-
222
-
223
-
224
-
225
-
226
-
227
-
228
-
229
-
230
-
231
-
232
-
233
-
234
-
235
-
236
-
237
-
238
-
239
-
240
-
241
-
242
-
243
-
244
-
245
-
246
-
247
-
248
-
249
-
250
-
251
-
252
-
253
-
254
-
255
-
256
-
257
-
258
-
259
-
260
-
261
-
262
-
263
-
264
 |
 |

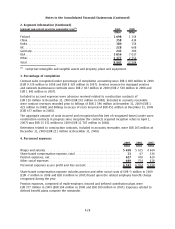
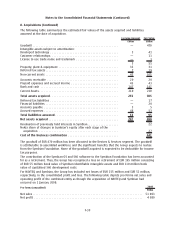
5. Pensions (Continued)
The following table sets forth the changes in the benefit obligation and fair value of plan assets
during the year and the funded status of the significant defined benefit pension plans showing the
amounts that are recognized in the Group’s consolidated statement of financial position at
December 31:
2009 2008
EURm EURm
Present value of defined benefit obligations at beginning of year ............... (1 205) (2 266)
Foreign exchange...................................................... 556
Current service cost .................................................... (55) (79)
Interest cost .......................................................... (69) (78)
Plan participants’ contributions . . . ....................................... (12) (10)
Past service cost ...................................................... —(2)
Actuarial gain (loss) .................................................... (139) 105
Acquisitions .......................................................... 2(2)
Curtailment .......................................................... —10
Settlements .......................................................... 21 025
Benefits paid ......................................................... 60 36
Present value of defined benefit obligations at end of year .................... (1 411) (1 205)
Plan assets at fair value at beginning of year ............................... 1 197 2 174
Foreign exchange...................................................... (7) (58)
Expected return on plan assets ........................................... 70 71
Actuarial gain (loss) on plan assets. ....................................... 56 (39)
Employer contribution .................................................. 49 141
Plan participants’ contributions . . . ....................................... 12 10
Benefits paid ......................................................... (44) (24)
Curtailments.......................................................... —(5)
Settlements .......................................................... (2) (1 078)
Acquisitions .......................................................... (1) 5
Plan assets at fair value at end of year..................................... 1 330 1 197
Surplus/(Deficit) ....................................................... (81) (8)
Unrecognized net actuarial (gains) losses ................................... (21) (113)
Unrecognized past service cost ........................................... 11
Amount not recognized as an asset in the balance sheet because of limit in IAS 19
paragraph 58(b) ..................................................... (5) —
Prepaid/(Accrued) pension cost in statement of financial position ............... (106) (120)
Present value of obligations include EUR 822 million (EUR 707 million in 2008) of wholly funded
obligations, EUR 516 million of partly funded obligations (EUR 416 million in 2008) and
EUR 73 million (EUR 82 million in 2008) of unfunded obligations.
F30
Notes to the Consolidated Financial Statements (Continued)