Nokia 2009 Annual Report Download - page 68
Download and view the complete annual report
Please find page 68 of the 2009 Nokia annual report below. You can navigate through the pages in the report by either clicking on the pages listed below, or by using the keyword search tool below to find specific information within the annual report.-
 1
1 -
2
-
3
-
4
-
5
-
6
-
7
-
8
-
9
-
10
-
11
-
12
-
13
-
14
-
15
-
16
-
17
-
18
-
19
-
20
-
21
-
22
-
23
-
24
-
25
-
26
-
27
-
28
-
29
-
30
-
31
-
32
-
33
-
34
-
35
-
36
-
37
-
38
-
39
-
40
-
41
-
42
-
43
-
44
-
45
-
46
-
47
-
48
-
49
-
50
-
51
-
52
-
53
-
54
-
55
-
56
-
57
-
 58
58 -
 59
59 -
 60
60 -
 61
61 -
 62
62 -
 63
63 -
 64
64 -
 65
65 -
 66
66 -
 67
67 -
 68
68 -
 69
69 -
 70
70 -
 71
71 -
 72
72 -
 73
73 -
 74
74 -
 75
75 -
 76
76 -
 77
77 -
 78
78 -
79
-
80
-
81
-
82
-
83
-
84
-
85
-
86
-
87
-
88
-
89
-
90
-
91
-
92
-
93
-
94
-
95
-
96
-
97
-
98
-
99
-
100
-
101
-
102
-
103
-
104
-
105
-
106
-
107
-
108
-
109
-
110
-
111
-
112
-
113
-
114
-
115
-
116
-
117
-
118
-
119
-
120
-
121
-
122
-
123
-
124
-
125
-
126
-
127
-
128
-
129
-
130
-
131
-
132
-
133
-
134
-
135
-
136
-
137
-
138
-
139
-
140
-
141
-
142
-
143
-
144
-
145
-
146
-
147
-
148
-
149
-
150
-
151
-
152
-
153
-
154
-
155
-
156
-
157
-
158
-
159
-
160
-
161
-
162
-
163
-
164
-
165
-
166
-
167
-
168
-
169
-
170
-
171
-
172
-
173
-
174
-
175
-
176
-
177
-
178
-
179
-
180
-
181
-
182
-
183
-
184
-
185
-
186
-
187
-
188
-
189
-
190
-
191
-
192
-
193
-
194
-
195
-
196
-
197
-
198
-
199
-
200
-
201
-
202
-
203
-
204
-
205
-
206
-
207
-
208
-
209
-
210
-
211
-
212
-
213
-
214
-
215
-
216
-
217
-
218
-
219
-
220
-
221
-
222
-
223
-
224
-
225
-
226
-
227
-
228
-
229
-
230
-
231
-
232
-
233
-
234
-
235
-
236
-
237
-
238
-
239
-
240
-
241
-
242
-
243
-
244
-
245
-
246
-
247
-
248
-
249
-
250
-
251
-
252
-
253
-
254
-
255
-
256
-
257
-
258
-
259
-
260
-
261
-
262
-
263
-
264
 |
 |
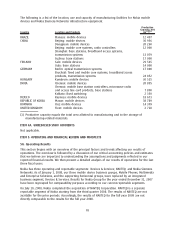
As of April 1, 2007, Nokia results include those of Nokia Siemens Networks on a fully consolidated
basis. Nokia Siemens Networks, a company jointly owned by Nokia and Siemens, is comprised of the
former Nokia Networks and Siemens’ carrierrelated operations for fixed and mobile networks.
Accordingly, the results of Nokia Group and Nokia Siemens Networks for the years ended
December 31, 2008 and 2009 are not directly comparable to the results for the year ended
December 31, 2007, as our results from January 1 to March 31, 2007 include our former Networks
business group only.
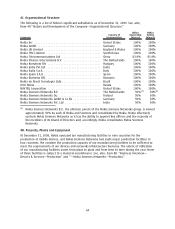
For a description of our organizational structure see Item 4A. — “History and Development of the
Company — Organizational Structure.” Business segment data in the following discussion is prior to
intersegment eliminations. See Note 2 to our consolidated financial statements included in Item 18
of this annual report. The following discussion should be read in conjunction with our consolidated
financial statements included in Item 18 of this annual report, Item 3D “Risk Factors” and “Forward
Looking Statements”. Our financial statements have been prepared in accordance with IFRS.
Principal Factors and Trends Affecting our Results of Operations
Devices & Services
The principal source of net sales in our Devices & Services business is the sale of mobile devices and
services and their combinations. Our mobile device portfolio ranges from basic mobile phones focused
on voice capability and mobile devices with a number of additional functionalities such as Internet
connectivity to highend converged mobile devices, including also mobile computers, which are based
on programmable software platforms, can run applications such as email, web browsing, navigation
and enterprise software, and can also have builtin music players, video recorders, mobile TV and
other multimedia features. Increasingly, we are focused on developing unique and compelling
combinations of mobile devices and services, together with the appropriate technological
infrastructure, to enrich the experience people have with their mobile devices. Our strategy is to have
a focused, optimallysized offering of mobile devices and services and their combinations enabling us
to effectively target all major consumer segments and price points, while meeting the local
requirements and preferences of our customers in the different markets we serve. Our customers
include mobile network operators, distributors, independent retailers, corporate customers and
consumers. We increasingly collaborate and partner with third parties to develop and obtain
technologies, products and services, including applications and content. We also target our mobile
device portfolio to be competitive and appealing for application developers and content providers to
develop applications and provide content for use in our devices.
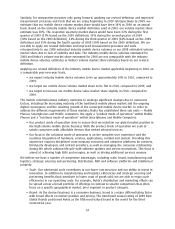
In 2009, the global mobile device market was negatively impacted by difficult global economic
conditions, including weaker consumer and corporate spending, constrained credit availability and
currency market volatility. In particular, the devaluation of emerging market currencies impacted the
purchasing power of consumers in emerging markets, where Nokia’s market position is strong. The
demand environment for mobile devices improved during the latter part of 2009 as the global
economy started to show initial signs of recovery. According to our estimates, in 2009 the industry
mobile device volumes, based on the definition of the industry mobile device market we used in
2009, decreased by 6% to 1.14 billion units, compared with an estimated 1.21 billion units in 2008.
Beginning in 2010, we are revising our definition of the industry mobile device market that we use to
estimate industry volumes. This is due to improved measurement processes and tools that enable us
to have better visibility to estimate the number of mobile devices sold by certain new entrants in the
global mobile device market. These include vendors of legitimate, as well as unlicensed and
counterfeit, products with manufacturing facilities primarily centered around certain locations in Asia
and other emerging markets. For comparative purposes only going forward, applying the revised
definition and improved measurement processes and tools that we are using beginning in 2010
retrospectively to 2009, we estimate that industry mobile device volumes in 2009 would have been
1.26 billion units.
66