Nokia 2009 Annual Report Download - page 200
Download and view the complete annual report
Please find page 200 of the 2009 Nokia annual report below. You can navigate through the pages in the report by either clicking on the pages listed below, or by using the keyword search tool below to find specific information within the annual report.-
 1
1 -
2
-
3
-
4
-
5
-
6
-
7
-
8
-
9
-
10
-
11
-
12
-
13
-
14
-
15
-
16
-
17
-
18
-
19
-
20
-
21
-
22
-
23
-
24
-
25
-
26
-
27
-
28
-
29
-
30
-
31
-
32
-
33
-
34
-
35
-
36
-
37
-
38
-
39
-
40
-
41
-
42
-
43
-
44
-
45
-
46
-
47
-
48
-
49
-
50
-
51
-
52
-
53
-
54
-
55
-
56
-
57
-
58
-
59
-
60
-
61
-
62
-
63
-
64
-
65
-
66
-
67
-
68
-
69
-
70
-
71
-
72
-
73
-
74
-
75
-
76
-
77
-
78
-
79
-
80
-
81
-
82
-
83
-
84
-
85
-
86
-
87
-
88
-
89
-
90
-
91
-
92
-
93
-
94
-
95
-
96
-
97
-
98
-
99
-
100
-
101
-
102
-
103
-
104
-
105
-
106
-
107
-
108
-
109
-
110
-
111
-
112
-
113
-
114
-
115
-
116
-
117
-
118
-
119
-
120
-
121
-
122
-
123
-
124
-
125
-
126
-
127
-
128
-
129
-
130
-
131
-
132
-
133
-
134
-
135
-
136
-
137
-
138
-
139
-
140
-
141
-
142
-
143
-
144
-
145
-
146
-
147
-
148
-
149
-
150
-
151
-
152
-
153
-
154
-
155
-
156
-
157
-
158
-
159
-
160
-
161
-
162
-
163
-
164
-
165
-
166
-
167
-
168
-
169
-
170
-
171
-
172
-
173
-
174
-
175
-
176
-
177
-
178
-
179
-
180
-
181
-
182
-
183
-
184
-
185
-
186
-
187
-
188
-
189
-
 190
190 -
 191
191 -
 192
192 -
 193
193 -
 194
194 -
 195
195 -
 196
196 -
 197
197 -
 198
198 -
 199
199 -
 200
200 -
 201
201 -
 202
202 -
 203
203 -
 204
204 -
 205
205 -
 206
206 -
 207
207 -
 208
208 -
 209
209 -
 210
210 -
211
-
212
-
213
-
214
-
215
-
216
-
217
-
218
-
219
-
220
-
221
-
222
-
223
-
224
-
225
-
226
-
227
-
228
-
229
-
230
-
231
-
232
-
233
-
234
-
235
-
236
-
237
-
238
-
239
-
240
-
241
-
242
-
243
-
244
-
245
-
246
-
247
-
248
-
249
-
250
-
251
-
252
-
253
-
254
-
255
-
256
-
257
-
258
-
259
-
260
-
261
-
262
-
263
-
264
 |
 |

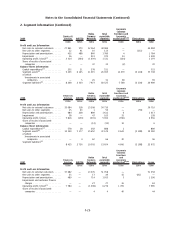
2. Segment information (Continued)
2009
Devices &
Services NAVTEQ
Nokia
Siemens
Networks
Total
reportable
segments
Corporate
Common
Functions and
Corporate
unallocated
(4),(6)
Eliminations Group
EURm EURm EURm EURm EURm EURm EURm
Profit and Loss Information
Net sales to external customers ..... 27841 579 12564 40984 — 40984
Net sales to other segments ........ 12 91 10 113 — (113) —
Depreciation and amortization ...... 432 488 860 1780 4 1784
Impairment ................... 56 — 919 975 34 1009
Operating profit / (loss)
(1)
......... 3314 (344) (1639) 1331 (134) 1197
Share of results of associated
companies .................. — — 32 32 (2) 30
Balance Sheet Information
Capital expenditures
(2)
............ 232 21 278 531 — 531
Segment assets
(3)
............... 9203 6145 11015 26363 12479 (3104) 35 738
of which:
Investments in associated
companies................. — 5 26 31 38 69
Segment liabilities
(5)
............. 8268 2330 7927 18525 5568 (3104) 20 989
2008
Devices &
Services NAVTEQ
Nokia
Siemens
Networks
Total
reportable
segments
Corporate
Common
Functions and
Corporate
unallocated
(4),(6)
Eliminations Group
EURm EURm EURm EURm EURm EURm EURm
Profit and Loss Information
Net sales to external customers ..... 35084 318 15308 50710 — 50710
Net sales to other segments ........ 15 43 1 59 — (59) —
Depreciation and amortization ...... 484 238 889 1611 6 1617
Impairment ................... 58 — 47 105 33 138
Operating profit / (loss) ........... 5816 (153) (301) 5362 (396) 4966
Share of results of associated
companies .................. — — (13) (13) 19 6
Balance Sheet Information
Capital expenditures
(2)
............ 578 18 292 888 1 889
Segment assets
(3)
............... 10300 7177 15652 33129 9641 (3188) 39 582
of which:
Investments in associated
companies................. — 4 62 66 30 96
Segment liabilities
(5)
8 425 2 726 10 503 21 654 4 606 (3 188) 23 072
2007
Devices &
Services NAVTEQ
Nokia
Siemens
Networks
Total
reportable
segments
Corporate
Common
Functions
and
Corporate
unallocated
(4),(6)
Eliminations Group
EURm EURm EURm EURm EURm EURm EURm
Profit and Loss Information
Net sales to external customers ..... 37682 — 13376 51058 — 51058
Net sales to other segments ........ 23 — 17 40 41 (81) —
Depreciation and amortization ...... 489 — 714 1203 3 1206
Impairment and customer finance
charges .................... — — 27 27 36 63
Operating profit / (loss)
(1)
......... 7584 — (1308) 6276 1709 7985
Share of results of associated
companies .................. — — 4 4 40 44
F26
Notes to the Consolidated Financial Statements (Continued)