Nokia 2009 Annual Report Download - page 254
Download and view the complete annual report
Please find page 254 of the 2009 Nokia annual report below. You can navigate through the pages in the report by either clicking on the pages listed below, or by using the keyword search tool below to find specific information within the annual report.-
 1
1 -
2
-
3
-
4
-
5
-
6
-
7
-
8
-
9
-
10
-
11
-
12
-
13
-
14
-
15
-
16
-
17
-
18
-
19
-
20
-
21
-
22
-
23
-
24
-
25
-
26
-
27
-
28
-
29
-
30
-
31
-
32
-
33
-
34
-
35
-
36
-
37
-
38
-
39
-
40
-
41
-
42
-
43
-
44
-
45
-
46
-
47
-
48
-
49
-
50
-
51
-
52
-
53
-
54
-
55
-
56
-
57
-
58
-
59
-
60
-
61
-
62
-
63
-
64
-
65
-
66
-
67
-
68
-
69
-
70
-
71
-
72
-
73
-
74
-
75
-
76
-
77
-
78
-
79
-
80
-
81
-
82
-
83
-
84
-
85
-
86
-
87
-
88
-
89
-
90
-
91
-
92
-
93
-
94
-
95
-
96
-
97
-
98
-
99
-
100
-
101
-
102
-
103
-
104
-
105
-
106
-
107
-
108
-
109
-
110
-
111
-
112
-
113
-
114
-
115
-
116
-
117
-
118
-
119
-
120
-
121
-
122
-
123
-
124
-
125
-
126
-
127
-
128
-
129
-
130
-
131
-
132
-
133
-
134
-
135
-
136
-
137
-
138
-
139
-
140
-
141
-
142
-
143
-
144
-
145
-
146
-
147
-
148
-
149
-
150
-
151
-
152
-
153
-
154
-
155
-
156
-
157
-
158
-
159
-
160
-
161
-
162
-
163
-
164
-
165
-
166
-
167
-
168
-
169
-
170
-
171
-
172
-
173
-
174
-
175
-
176
-
177
-
178
-
179
-
180
-
181
-
182
-
183
-
184
-
185
-
186
-
187
-
188
-
189
-
190
-
191
-
192
-
193
-
194
-
195
-
196
-
197
-
198
-
199
-
200
-
201
-
202
-
203
-
204
-
205
-
206
-
207
-
208
-
209
-
210
-
211
-
212
-
213
-
214
-
215
-
216
-
217
-
218
-
219
-
220
-
221
-
222
-
223
-
224
-
225
-
226
-
227
-
228
-
229
-
230
-
231
-
232
-
233
-
234
-
235
-
236
-
237
-
238
-
239
-
240
-
241
-
242
-
243
-
 244
244 -
 245
245 -
 246
246 -
 247
247 -
 248
248 -
 249
249 -
 250
250 -
 251
251 -
 252
252 -
 253
253 -
 254
254 -
 255
255 -
 256
256 -
 257
257 -
 258
258 -
 259
259 -
 260
260 -
 261
261 -
 262
262 -
 263
263 -
 264
264
 |
 |

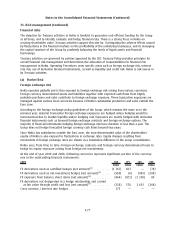
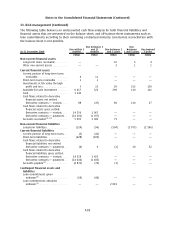
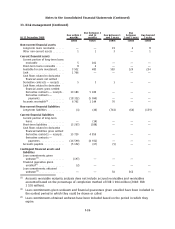
33. Risk management (Continued)
• FX derivatives designated as forecasted cash flow hedges and net investment hedges. Most of the
VaR is caused by these derivatives as forecasted cash flow and net investment exposures are not
financial instruments as defined under IFRS 7 and thus not included in the VaR calculation.
Table 1 Foreign exchange positions ValueatRisk
2009 2008
VaR from financial
instruments
EURm EURm
At December 31 .................................................... 190 442
Average for the year ................................................ 291 337
Range for the year .................................................. 160520 191730
Interest rate risk
The VaR for the Group interest rate exposure in the investment and debt portfolios is presented in
Table 2 below. Sensitivities to credit spreads are not reflected in the below numbers.
The sizeable difference between the 2009 and 2008 numbers is mainly due the fact that Nokia issued
bonds with long maturities during the first half of 2009, which resulted in a significant increase in
the Group’s exposure to longterm interest rates.
Table 2 Treasury investment and debt portfolios ValueatRisk
2009 2008
EURm EURm
At December 31 .......................................................... 41 6
Average for the year ...................................................... 33 10
Range for the year........................................................ 452 425
Equity price risk
The VaR for the Group equity investment in publicly traded companies is insignificant.
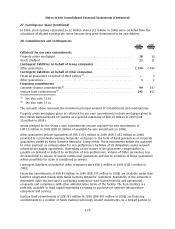
(b) Credit Risk
Credit risk refers to the risk that a counterparty will default on its contractual obligations resulting in
financial loss to the Group. Credit risk arises from bank and cash, fixed income and moneymarket
investments, derivative financial instruments, loans receivable as well as credit exposures to
customers, including outstanding receivables, financial guarantees and committed transactions. Credit
risk is managed separately for business related and financialcredit exposures.
Except as detailed in the following table, the maximum exposure to credit risk is limited to the book
value of the financial assets as included in Group’s balance sheet:
2009 2008
EURm EURm
Financial guarantees given on behalf of customers and other third parties ........... —2
Loan commitments given but not used ....................................... 99 197
99 199
F80
Notes to the Consolidated Financial Statements (Continued)