Nokia 2009 Annual Report Download - page 113
Download and view the complete annual report
Please find page 113 of the 2009 Nokia annual report below. You can navigate through the pages in the report by either clicking on the pages listed below, or by using the keyword search tool below to find specific information within the annual report.-
 1
1 -
2
-
3
-
4
-
5
-
6
-
7
-
8
-
9
-
10
-
11
-
12
-
13
-
14
-
15
-
16
-
17
-
18
-
19
-
20
-
21
-
22
-
23
-
24
-
25
-
26
-
27
-
28
-
29
-
30
-
31
-
32
-
33
-
34
-
35
-
36
-
37
-
38
-
39
-
40
-
41
-
42
-
43
-
44
-
45
-
46
-
47
-
48
-
49
-
50
-
51
-
52
-
53
-
54
-
55
-
56
-
57
-
58
-
59
-
60
-
61
-
62
-
63
-
64
-
65
-
66
-
67
-
68
-
69
-
70
-
71
-
72
-
73
-
74
-
75
-
76
-
77
-
78
-
79
-
80
-
81
-
82
-
83
-
84
-
85
-
86
-
87
-
88
-
89
-
90
-
91
-
92
-
93
-
94
-
95
-
96
-
97
-
98
-
99
-
100
-
101
-
102
-
 103
103 -
 104
104 -
 105
105 -
 106
106 -
 107
107 -
 108
108 -
 109
109 -
 110
110 -
 111
111 -
 112
112 -
 113
113 -
 114
114 -
 115
115 -
 116
116 -
 117
117 -
 118
118 -
 119
119 -
 120
120 -
 121
121 -
 122
122 -
 123
123 -
124
-
125
-
126
-
127
-
128
-
129
-
130
-
131
-
132
-
133
-
134
-
135
-
136
-
137
-
138
-
139
-
140
-
141
-
142
-
143
-
144
-
145
-
146
-
147
-
148
-
149
-
150
-
151
-
152
-
153
-
154
-
155
-
156
-
157
-
158
-
159
-
160
-
161
-
162
-
163
-
164
-
165
-
166
-
167
-
168
-
169
-
170
-
171
-
172
-
173
-
174
-
175
-
176
-
177
-
178
-
179
-
180
-
181
-
182
-
183
-
184
-
185
-
186
-
187
-
188
-
189
-
190
-
191
-
192
-
193
-
194
-
195
-
196
-
197
-
198
-
199
-
200
-
201
-
202
-
203
-
204
-
205
-
206
-
207
-
208
-
209
-
210
-
211
-
212
-
213
-
214
-
215
-
216
-
217
-
218
-
219
-
220
-
221
-
222
-
223
-
224
-
225
-
226
-
227
-
228
-
229
-
230
-
231
-
232
-
233
-
234
-
235
-
236
-
237
-
238
-
239
-
240
-
241
-
242
-
243
-
244
-
245
-
246
-
247
-
248
-
249
-
250
-
251
-
252
-
253
-
254
-
255
-
256
-
257
-
258
-
259
-
260
-
261
-
262
-
263
-
264
 |
 |

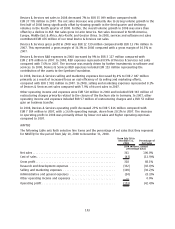
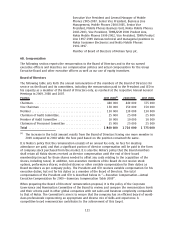
The following table sets forth the amounts of our contingent commitments for the periods indicated
as at December 31, 2009. The amounts represent the maximum principal amount of commitments.
Contingent Commitments Expiration Per Period
2010 20112012 20132014 Thereafter Total
(EUR millions)
Guarantees of Nokia’s performance ............ 669 154 51 139 1013
Guarantees of Nokia’s performance consist of EUR 1 013 million of guarantees that are provided to
certain Nokia Siemens Networks customers in the form of bank guarantees, or corporate guarantees
issued by Nokia Siemens Networks’ Group entity. These instruments entitle the customer to claim
payment as compensation for nonperformance by Nokia Siemens Networks of its obligations under
network infrastructure supply agreements. Depending on the nature of the instrument, compensation
is payable either on demand, or subject to verification of nonperformance. Volume of guarantees of
Nokia’s performance has decreased due to release of certain commercial guarantees and due to
exclusion of those guarantees where possibility for claim is considered as remote.
Financial guarantees and securities pledged we may give on behalf of customers represent
guarantees relating to payment by certain Nokia Siemens Networks’ customers and other third
parties under specified loan facilities between such a customer or other third parties and their
creditors. Nokia’s obligations under such guarantees are released upon the earlier of expiration of the
guarantee or early payment by the customer or other third party.
See Note 28 to our consolidated financial statements included in Item 18 of this annual report for
further information regarding commitments and contingencies.
5C. Research and Development, Patents and Licenses
Success in the mobile communications industry requires continuous introduction of new products and
services and their combinations based on the latest available technology. This places considerable
demands on our research and development, or R&D activities. Consequently, in order to maintain our
competitiveness, we have made substantial R&D investments in each of the last three years. Our
consolidated R&D expenses for 2009 were EUR 5 909 million, a decrease of 1% from
EUR 5 968 million in 2008. The decrease in R&D expenses was primarily due to decreased R&D
expenses in Devices & Services and Nokia Siemens Networks. R&D expenses in 2007 were EUR 5
636 million. These expenses represented 14.4%, 11.8% and 11.0% of Nokia net sales in 2009, 2008
and 2007, respectively. In 2009, Devices & Services R&D expenses included EUR 8 million of purchase
price accounting related items. In 2008, Devices & Services R&D expenses included EUR 153 million
representing the contribution of the assets to the Symbian Foundation. In 2009, Nokia Siemens
Networks incurred a restructuring charge of EUR 30 million and EUR 180 million of purchase price
accounting related items, compared to EUR 46 million and EUR 180 million in 2008, respectively. In
2007, Nokia Siemens Networks incurred a restructuring charge of EUR 439 million and
EUR 136 million purchase price accounting related items related to R&D activities. In 2009, NAVTEQ
R&D expenses included EUR 346 million of purchase price accounting related items. NAVTEQ R&D
expenses for the six months ended on December, 2009, included EUR 171 million of purchase price
accounting related items.
To enable our future success, we continued to improve the efficiency of our worldwide R&D network
and increased our collaboration with third parties. At December 31, 2009, we employed
37 020 people in R&D, representing approximately 30% of our total workforce, and had a strong
research and development presence in 16 countries. R&D expenses of Devices & Services as a
percentage of its net sales were 10.7% in 2009 compared with 8.9% in 2008 and 7.6% in 2007.
NAVTEQ R&D expenses represented 97.5% of its net sales in 2009 compared to 92.0% for the six
months ended on December 31, 2008. In the case of Nokia Siemens Networks, R&D expenses
represented 18.1%, 16.3% and 20.5% of its net sales in 2009, 2008 and 2007, respectively.
111