Nokia 2009 Annual Report Download - page 251
Download and view the complete annual report
Please find page 251 of the 2009 Nokia annual report below. You can navigate through the pages in the report by either clicking on the pages listed below, or by using the keyword search tool below to find specific information within the annual report.-
 1
1 -
2
-
3
-
4
-
5
-
6
-
7
-
8
-
9
-
10
-
11
-
12
-
13
-
14
-
15
-
16
-
17
-
18
-
19
-
20
-
21
-
22
-
23
-
24
-
25
-
26
-
27
-
28
-
29
-
30
-
31
-
32
-
33
-
34
-
35
-
36
-
37
-
38
-
39
-
40
-
41
-
42
-
43
-
44
-
45
-
46
-
47
-
48
-
49
-
50
-
51
-
52
-
53
-
54
-
55
-
56
-
57
-
58
-
59
-
60
-
61
-
62
-
63
-
64
-
65
-
66
-
67
-
68
-
69
-
70
-
71
-
72
-
73
-
74
-
75
-
76
-
77
-
78
-
79
-
80
-
81
-
82
-
83
-
84
-
85
-
86
-
87
-
88
-
89
-
90
-
91
-
92
-
93
-
94
-
95
-
96
-
97
-
98
-
99
-
100
-
101
-
102
-
103
-
104
-
105
-
106
-
107
-
108
-
109
-
110
-
111
-
112
-
113
-
114
-
115
-
116
-
117
-
118
-
119
-
120
-
121
-
122
-
123
-
124
-
125
-
126
-
127
-
128
-
129
-
130
-
131
-
132
-
133
-
134
-
135
-
136
-
137
-
138
-
139
-
140
-
141
-
142
-
143
-
144
-
145
-
146
-
147
-
148
-
149
-
150
-
151
-
152
-
153
-
154
-
155
-
156
-
157
-
158
-
159
-
160
-
161
-
162
-
163
-
164
-
165
-
166
-
167
-
168
-
169
-
170
-
171
-
172
-
173
-
174
-
175
-
176
-
177
-
178
-
179
-
180
-
181
-
182
-
183
-
184
-
185
-
186
-
187
-
188
-
189
-
190
-
191
-
192
-
193
-
194
-
195
-
196
-
197
-
198
-
199
-
200
-
201
-
202
-
203
-
204
-
205
-
206
-
207
-
208
-
209
-
210
-
211
-
212
-
213
-
214
-
215
-
216
-
217
-
218
-
219
-
220
-
221
-
222
-
223
-
224
-
225
-
226
-
227
-
228
-
229
-
230
-
231
-
232
-
233
-
234
-
235
-
236
-
237
-
238
-
239
-
240
-
 241
241 -
 242
242 -
 243
243 -
 244
244 -
 245
245 -
 246
246 -
 247
247 -
 248
248 -
 249
249 -
 250
250 -
 251
251 -
 252
252 -
 253
253 -
 254
254 -
 255
255 -
 256
256 -
 257
257 -
 258
258 -
 259
259 -
 260
260 -
 261
261 -
262
-
263
-
264
 |
 |

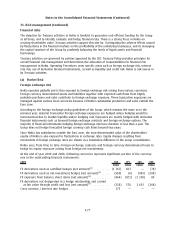
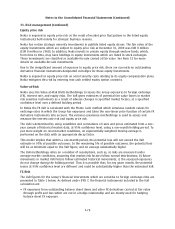
33. Risk management (Continued)
Financial risks
The objective for Treasury activities in Nokia is twofold: to guarantee costefficient funding for the Group
at all times, and to identify, evaluate and hedge financial risks. There is a strong focus in Nokia on
creating shareholder value. Treasury activities support this aim by: i) mitigating the adverse effects caused
by fluctuations in the financial markets on the profitability of the underlying businesses; and ii) managing
the capital structure of the Group by prudently balancing the levels of liquid assets and financial
borrowings.
Treasury activities are governed by policies approved by the CEO. Treasury Policy provides principles for
overall financial risk management and determines the allocation of responsibilities for financial risk
management in Nokia. Operating Procedures cover specific areas such as foreign exchange risk, interest
rate risk, use of derivative financial instruments, as well as liquidity and credit risk. Nokia is risk averse in
its Treasury activities.
(a) Market Risk
Foreign exchange risk
Nokia operates globally and is thus exposed to foreign exchange risk arising from various currencies.
Foreign currency denominated assets and liabilities together with expected cash flows from highly
probable purchases and sales contribute to foreign exchange exposure. These transaction exposures are
managed against various local currencies because of Nokia’s substantial production and sales outside the
Euro zone.
According to the foreign exchange policy guidelines of the Group, which remains the same as in the
previous year, material transaction foreign exchange exposures are hedged unless hedging would be
uneconomical due to market liquidity and/or hedging cost. Exposures are mainly hedged with derivative
financial instruments such as forward foreign exchange contracts and foreign exchange options. The
majority of financial instruments hedging foreign exchange risk have duration of less than a year. The
Group does not hedge forecasted foreign currency cash flows beyond two years.
Since Nokia has subsidiaries outside the Euro zone, the eurodenominated value of the shareholders’
equity of Nokia is also exposed to fluctuations in exchange rates. Equity changes resulting from
movementsinforeignexchangeratesareshownasatranslationdifferenceintheGroupconsolidation.
Nokia uses, from time to time, foreign exchange contracts and foreign currency denominated loans to
hedge its equity exposure arising from foreign net investments.
At the end of year 2009 and 2008, following currencies represent significant portion of the currency
mix in the outstanding financial instruments:
2009 USD JPY CNY INR
EURm EURm EURm EURm
FX derivatives used as cashflow hedges (net amount)
(1)
.......... (1767) 663 — (78)
FX derivatives used as net investment hedges (net amount)
(2)
..... (969) (6) (983) (208)
FX exposure from balance sheet items (net amount)
(3)
........... (464) (421) (1358) 80
FX derivatives not designated in a hedge relationship and carried
at fair value through profit and loss (net amount)
(3)
........... (328) 578 1633 (164)
Cross currency / interest rate hedges ......................... 375 — — —
F77
Notes to the Consolidated Financial Statements (Continued)