Nokia 2009 Annual Report Download - page 95
Download and view the complete annual report
Please find page 95 of the 2009 Nokia annual report below. You can navigate through the pages in the report by either clicking on the pages listed below, or by using the keyword search tool below to find specific information within the annual report.-
 1
1 -
2
-
3
-
4
-
5
-
6
-
7
-
8
-
9
-
10
-
11
-
12
-
13
-
14
-
15
-
16
-
17
-
18
-
19
-
20
-
21
-
22
-
23
-
24
-
25
-
26
-
27
-
28
-
29
-
30
-
31
-
32
-
33
-
34
-
35
-
36
-
37
-
38
-
39
-
40
-
41
-
42
-
43
-
44
-
45
-
46
-
47
-
48
-
49
-
50
-
51
-
52
-
53
-
54
-
55
-
56
-
57
-
58
-
59
-
60
-
61
-
62
-
63
-
64
-
65
-
66
-
67
-
68
-
69
-
70
-
71
-
72
-
73
-
74
-
75
-
76
-
77
-
78
-
79
-
80
-
81
-
82
-
83
-
84
-
 85
85 -
 86
86 -
 87
87 -
 88
88 -
 89
89 -
 90
90 -
 91
91 -
 92
92 -
 93
93 -
 94
94 -
 95
95 -
 96
96 -
 97
97 -
 98
98 -
 99
99 -
 100
100 -
 101
101 -
 102
102 -
 103
103 -
 104
104 -
 105
105 -
106
-
107
-
108
-
109
-
110
-
111
-
112
-
113
-
114
-
115
-
116
-
117
-
118
-
119
-
120
-
121
-
122
-
123
-
124
-
125
-
126
-
127
-
128
-
129
-
130
-
131
-
132
-
133
-
134
-
135
-
136
-
137
-
138
-
139
-
140
-
141
-
142
-
143
-
144
-
145
-
146
-
147
-
148
-
149
-
150
-
151
-
152
-
153
-
154
-
155
-
156
-
157
-
158
-
159
-
160
-
161
-
162
-
163
-
164
-
165
-
166
-
167
-
168
-
169
-
170
-
171
-
172
-
173
-
174
-
175
-
176
-
177
-
178
-
179
-
180
-
181
-
182
-
183
-
184
-
185
-
186
-
187
-
188
-
189
-
190
-
191
-
192
-
193
-
194
-
195
-
196
-
197
-
198
-
199
-
200
-
201
-
202
-
203
-
204
-
205
-
206
-
207
-
208
-
209
-
210
-
211
-
212
-
213
-
214
-
215
-
216
-
217
-
218
-
219
-
220
-
221
-
222
-
223
-
224
-
225
-
226
-
227
-
228
-
229
-
230
-
231
-
232
-
233
-
234
-
235
-
236
-
237
-
238
-
239
-
240
-
241
-
242
-
243
-
244
-
245
-
246
-
247
-
248
-
249
-
250
-
251
-
252
-
253
-
254
-
255
-
256
-
257
-
258
-
259
-
260
-
261
-
262
-
263
-
264
 |
 |

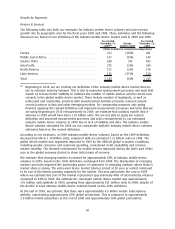
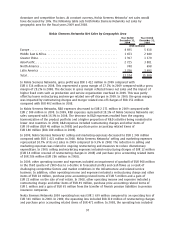
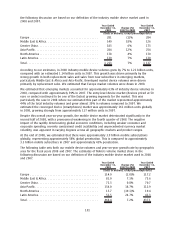
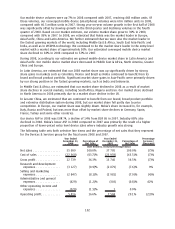
The following table sets forth our mobile device volumes and yearonyear growth rate by geographic
area for the fiscal years 2009 and 2008. The estimates of Nokia’s volume market share in the
following discussion are based on our definition of the industry mobile device market used in 2009
and 2008.
Year Ended
December 31,
2009
(*)
Change
2008 to 2009
Year Ended
December 31,
2008
(Units in millions, except percentage data)
Europe .......................................... 107.0 (6.9)% 114.9
Middle East & Africa ................................ 77.7 (4.1)% 81.0
Greater China ..................................... 72.6 1.8% 71.3
AsiaPacific. . ..................................... 123.5 (7.8)% 134.0
North America .................................... 13.5 (14.0)% 15.7
Latin America..................................... 37.5 (27.2)% 51.5
Total ............................................ 431.8 (7.8)% 468.4
* For comparative purposes only going forward, applying the revised definition of the industry
mobile device market (see note 1 to the industry mobile device volume table above)
retrospectively to 2009, Nokia estimates that its mobile device volume market share would have
been 34% in 2009 on an annual basis. Nokia is not able to apply the revised definition and
improved measurement processes and tools retrospectively Nokia’s estimated volume market
share in 2008 due to lack of visibility and data. Nokia’s volume market share estimated for 2008
is not comparable with Nokia’s volume market share estimates based on the revised definition.
Our mobile device volumes declined 8% in 2009 compared with 2008, to 432 million units. Of those
volumes, our converged mobile device volumes were 67.8 million units in 2009, compared with
60.6 million units in 2008. The yearonyear volume decline in our mobile device volumes was
primarily due to difficult global economic conditions, including weaker consumer and corporate
spending, constrained credit availability and currency market volatility. Based on the industry mobile
device market definition we used in 2009 and 2008, our mobile device volume market share
decreased to 38% in 2009, compared with 39% in 2008. The decrease in our device volume market
share was primarily due to intense competition. In 2009, we estimate that Nokia was the market
leader in Europe, AsiaPacific, China and Latin America. We further estimate that we were also the
market leader in the fastest growing markets of the world, including Middle East & Africa, South East
AsiaPacific and India. We continued to be the market share leader in the entrylevel market with an
estimated market share of approximately 45%. We also continued to be the market share leader in
converged mobile devices. Our estimated converged mobile device market share remained unchanged
at 38% in 2009, compared with 2008, despite strong competition.
During 2009, based on the industry mobile device market definition we used in 2009, we estimate
that Nokia gained mobile device market share in Europe and Middle East & Africa. Our device market
share decreased in AsiaPacific, Latin America and North America. Our device market share was flat in
Greater China.
In Europe, we estimate that our market share increased. Nokia’s share increased in, for example,
Germany, the United Kingdom, Russia and Spain, but was partly offset by market share declines in
Italy, Finland, Ireland and some other countries. In Middle East & Africa our market share increased
driven by share gains for instance in Nigeria.
In AsiaPacific, Nokia’s market share declined in 2009 as a result of market share losses in several
markets, including Singapore and Thailand. In Latin America, Nokia’s market share declined in 2009
as a result of market share losses in several markets, including Brazil, Mexico and Argentina. Our
market share declined in North America in 2009 primarily due to a market share decline in the United
93