Nokia 2009 Annual Report Download - page 103
Download and view the complete annual report
Please find page 103 of the 2009 Nokia annual report below. You can navigate through the pages in the report by either clicking on the pages listed below, or by using the keyword search tool below to find specific information within the annual report.-
 1
1 -
2
-
3
-
4
-
5
-
6
-
7
-
8
-
9
-
10
-
11
-
12
-
13
-
14
-
15
-
16
-
17
-
18
-
19
-
20
-
21
-
22
-
23
-
24
-
25
-
26
-
27
-
28
-
29
-
30
-
31
-
32
-
33
-
34
-
35
-
36
-
37
-
38
-
39
-
40
-
41
-
42
-
43
-
44
-
45
-
46
-
47
-
48
-
49
-
50
-
51
-
52
-
53
-
54
-
55
-
56
-
57
-
58
-
59
-
60
-
61
-
62
-
63
-
64
-
65
-
66
-
67
-
68
-
69
-
70
-
71
-
72
-
73
-
74
-
75
-
76
-
77
-
78
-
79
-
80
-
81
-
82
-
83
-
84
-
85
-
86
-
87
-
88
-
89
-
90
-
91
-
92
-
 93
93 -
 94
94 -
 95
95 -
 96
96 -
 97
97 -
 98
98 -
 99
99 -
 100
100 -
 101
101 -
 102
102 -
 103
103 -
 104
104 -
 105
105 -
 106
106 -
 107
107 -
 108
108 -
 109
109 -
 110
110 -
 111
111 -
 112
112 -
 113
113 -
114
-
115
-
116
-
117
-
118
-
119
-
120
-
121
-
122
-
123
-
124
-
125
-
126
-
127
-
128
-
129
-
130
-
131
-
132
-
133
-
134
-
135
-
136
-
137
-
138
-
139
-
140
-
141
-
142
-
143
-
144
-
145
-
146
-
147
-
148
-
149
-
150
-
151
-
152
-
153
-
154
-
155
-
156
-
157
-
158
-
159
-
160
-
161
-
162
-
163
-
164
-
165
-
166
-
167
-
168
-
169
-
170
-
171
-
172
-
173
-
174
-
175
-
176
-
177
-
178
-
179
-
180
-
181
-
182
-
183
-
184
-
185
-
186
-
187
-
188
-
189
-
190
-
191
-
192
-
193
-
194
-
195
-
196
-
197
-
198
-
199
-
200
-
201
-
202
-
203
-
204
-
205
-
206
-
207
-
208
-
209
-
210
-
211
-
212
-
213
-
214
-
215
-
216
-
217
-
218
-
219
-
220
-
221
-
222
-
223
-
224
-
225
-
226
-
227
-
228
-
229
-
230
-
231
-
232
-
233
-
234
-
235
-
236
-
237
-
238
-
239
-
240
-
241
-
242
-
243
-
244
-
245
-
246
-
247
-
248
-
249
-
250
-
251
-
252
-
253
-
254
-
255
-
256
-
257
-
258
-
259
-
260
-
261
-
262
-
263
-
264
 |
 |

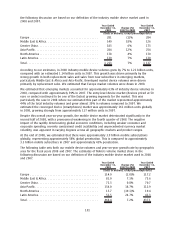
the following discussion are based on our definition of the industry mobile device market used in
2008 and 2007.
Year Ended
December 31,
2008
Change (%)
2007 to 2008
Year Ended
December 31,
2007
(Units in millions, except percentage data)
Europe .......................................... 281 (1)% 284
Middle East & Africa ................................ 149 18% 126
Greater China ..................................... 183 6% 173
AsiaPacific. . ..................................... 284 12% 254
North America .................................... 178 4% 170
Latin America..................................... 139 7% 130
Total ............................................ 1213 7% 1137
According to our estimates, in 2008 industry mobile device volumes grew by 7% to 1.21 billion units,
compared with an estimated 1.14 billion units in 2007. This growth was driven primarily by the
strong growth in both replacement sales and sales from new subscribers in emerging markets,
particularly Middle East & Africa and AsiaPacific. Developed market device volumes were driven
primarily by replacement sales. We estimated that Europe market volumes were down in 2008.
We estimated that emerging markets accounted for approximately 63% of industry device volumes in
2008, compared with approximately 59% in 2007. The entrylevel device market (devices priced at 50
euro or under) continued to be one of the fastest growing segments for the market. This was
particularly the case in 2008 where we estimated this part of the market represented approximately
44% of the total industry volumes and grew almost 30% in volumes compared to 2007. We
estimated the converged device (smartphones) market was approximately 161 million units globally
in 2008, growing strongly from approximately 117 million units in 2007.
Despite this overall yearonyear growth, the mobile device market deteriorated significantly in the
second half of 2008, with a pronounced weakening in the fourth quarter of 2008. The negative
impact of the rapidly deteriorating global economic conditions, including weaker consumer and
corporate spending, severely constrained credit availability and unprecedented currency market
volatility, was apparent in varying degrees across all geographic markets and product ranges.
At the end of 2008, we estimated that there were approximately 3.9 billion mobile subscriptions
globally, representing approximately 58% global penetration. This is compared to approximately
3.3 billion mobile subscribers in 2007 and approximately 43% penetration.
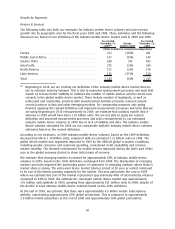
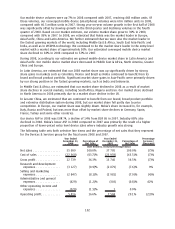
The following table sets forth our mobile device volumes and yearonyear growth rate by geographic
area for the fiscal years 2008 and 2007. The estimates of Nokia’s volume market share in the
following discussion are based on our definition of the industry mobile device market used in 2008
and 2007.
Year Ended
December 31,
2008
Change (%)
2007 to 2008
Year Ended
December 31,
2007
(Units in millions, except percentage data)
Europe .......................................... 114.9 (2.0)% 117.2
Middle East & Africa ................................ 81.0 7.1% 75.6
Greater China ..................................... 71.3 0.8% 70.7
AsiaPacific. . ..................................... 134.0 18.7% 112.9
North America .................................... 15.7 (19.1)% 19.4
Latin America..................................... 51.5 24.7% 41.3
Total ............................................ 468.4 7.2% 437.1
101