Nokia 2009 Annual Report Download - page 202
Download and view the complete annual report
Please find page 202 of the 2009 Nokia annual report below. You can navigate through the pages in the report by either clicking on the pages listed below, or by using the keyword search tool below to find specific information within the annual report.-
 1
1 -
2
-
3
-
4
-
5
-
6
-
7
-
8
-
9
-
10
-
11
-
12
-
13
-
14
-
15
-
16
-
17
-
18
-
19
-
20
-
21
-
22
-
23
-
24
-
25
-
26
-
27
-
28
-
29
-
30
-
31
-
32
-
33
-
34
-
35
-
36
-
37
-
38
-
39
-
40
-
41
-
42
-
43
-
44
-
45
-
46
-
47
-
48
-
49
-
50
-
51
-
52
-
53
-
54
-
55
-
56
-
57
-
58
-
59
-
60
-
61
-
62
-
63
-
64
-
65
-
66
-
67
-
68
-
69
-
70
-
71
-
72
-
73
-
74
-
75
-
76
-
77
-
78
-
79
-
80
-
81
-
82
-
83
-
84
-
85
-
86
-
87
-
88
-
89
-
90
-
91
-
92
-
93
-
94
-
95
-
96
-
97
-
98
-
99
-
100
-
101
-
102
-
103
-
104
-
105
-
106
-
107
-
108
-
109
-
110
-
111
-
112
-
113
-
114
-
115
-
116
-
117
-
118
-
119
-
120
-
121
-
122
-
123
-
124
-
125
-
126
-
127
-
128
-
129
-
130
-
131
-
132
-
133
-
134
-
135
-
136
-
137
-
138
-
139
-
140
-
141
-
142
-
143
-
144
-
145
-
146
-
147
-
148
-
149
-
150
-
151
-
152
-
153
-
154
-
155
-
156
-
157
-
158
-
159
-
160
-
161
-
162
-
163
-
164
-
165
-
166
-
167
-
168
-
169
-
170
-
171
-
172
-
173
-
174
-
175
-
176
-
177
-
178
-
179
-
180
-
181
-
182
-
183
-
184
-
185
-
186
-
187
-
188
-
189
-
190
-
191
-
 192
192 -
 193
193 -
 194
194 -
 195
195 -
 196
196 -
 197
197 -
 198
198 -
 199
199 -
 200
200 -
 201
201 -
 202
202 -
 203
203 -
 204
204 -
 205
205 -
 206
206 -
 207
207 -
 208
208 -
 209
209 -
 210
210 -
 211
211 -
 212
212 -
213
-
214
-
215
-
216
-
217
-
218
-
219
-
220
-
221
-
222
-
223
-
224
-
225
-
226
-
227
-
228
-
229
-
230
-
231
-
232
-
233
-
234
-
235
-
236
-
237
-
238
-
239
-
240
-
241
-
242
-
243
-
244
-
245
-
246
-
247
-
248
-
249
-
250
-
251
-
252
-
253
-
254
-
255
-
256
-
257
-
258
-
259
-
260
-
261
-
262
-
263
-
264
 |
 |

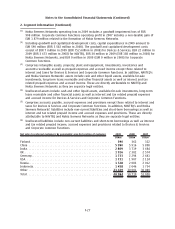
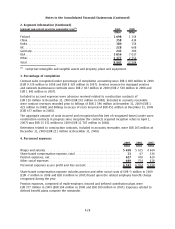
2. Segment information (Continued)
Segment noncurrent assets by geographic area
(7)
2009 2008
EURm EURm
Finland .................................................. 1 698 1 154
China ................................................... 358 434
India .................................................... 180 154
UK...................................................... 228 668
Germany ................................................. 243 306
USA..................................................... 5 859 7 037
Other ................................................... 1 377 2 751
Total .................................................... 9 943 12 504
(7)
Comprises intangible and tangible assets and property, plant and equipment.
3. Percentage of completion
Contract sales recognized under percentage of completion accounting were EUR 6 868 million in 2009
(EUR 9 220 million in 2008 and EUR 8 329 million in 2007). Services revenue for managed services
and network maintenance contracts were EUR 2 607 million in 2009 (EUR 2 530 million in 2008 and
EUR 1 842 million in 2007).
Included in accrued expenses were advances received related to construction contracts of
EUR 126 million at December 31, 2009 (EUR 261 million in 2008). Included in accounts receivable
were contract revenues recorded prior to billings of EUR 1 396 million at December 31, 2009 (EUR 1
423 million in 2008) and billings in excess of costs incurred of EUR 451 million at December 31, 2009
(EUR 677 million in 2008).
The aggregate amount of costs incurred and recognized profits (net of recognized losses) under open
construction contracts in progress since inception (for contracts acquired inception refers to April 1,
2007) was EUR 15 351 million in 2009 (EUR 11 707 million in 2008).
Retentions related to construction contracts, included in accounts receivable, were EUR 265 million at
December 31, 2009 (EUR 211 million at December 31, 2008).
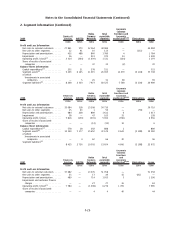
4. Personnel expenses
2009 2008 2007
EURm EURm EURm
Wages and salaries .............................................. 5 658 5 615 4 664
Sharebased compensation expense, total ............................ 13 67 236
Pension expenses, net ............................................ 427 478 420
Other social expenses ............................................ 649 754 618
Personnel expenses as per profit and loss account ..................... 6 747 6 914 5 938
Sharebased compensation expense includes pension and other social costs of EUR 3 million in 2009
(EUR 7 million in 2008 and EUR 8 million in 2007) based upon the related employee benefit charge
recognized during the year.
Pension expenses, comprised of multiemployer, insured and defined contribution plans were
EUR 377 million in 2009 (EUR 394 million in 2008 and EUR 289 million in 2007). Expenses related to
defined benefit plans comprise the remainder.
F28
Notes to the Consolidated Financial Statements (Continued)