Nokia 2009 Annual Report Download - page 106
Download and view the complete annual report
Please find page 106 of the 2009 Nokia annual report below. You can navigate through the pages in the report by either clicking on the pages listed below, or by using the keyword search tool below to find specific information within the annual report.-
 1
1 -
2
-
3
-
4
-
5
-
6
-
7
-
8
-
9
-
10
-
11
-
12
-
13
-
14
-
15
-
16
-
17
-
18
-
19
-
20
-
21
-
22
-
23
-
24
-
25
-
26
-
27
-
28
-
29
-
30
-
31
-
32
-
33
-
34
-
35
-
36
-
37
-
38
-
39
-
40
-
41
-
42
-
43
-
44
-
45
-
46
-
47
-
48
-
49
-
50
-
51
-
52
-
53
-
54
-
55
-
56
-
57
-
58
-
59
-
60
-
61
-
62
-
63
-
64
-
65
-
66
-
67
-
68
-
69
-
70
-
71
-
72
-
73
-
74
-
75
-
76
-
77
-
78
-
79
-
80
-
81
-
82
-
83
-
84
-
85
-
86
-
87
-
88
-
89
-
90
-
91
-
92
-
93
-
94
-
95
-
 96
96 -
 97
97 -
 98
98 -
 99
99 -
 100
100 -
 101
101 -
 102
102 -
 103
103 -
 104
104 -
 105
105 -
 106
106 -
 107
107 -
 108
108 -
 109
109 -
 110
110 -
 111
111 -
 112
112 -
 113
113 -
 114
114 -
 115
115 -
 116
116 -
117
-
118
-
119
-
120
-
121
-
122
-
123
-
124
-
125
-
126
-
127
-
128
-
129
-
130
-
131
-
132
-
133
-
134
-
135
-
136
-
137
-
138
-
139
-
140
-
141
-
142
-
143
-
144
-
145
-
146
-
147
-
148
-
149
-
150
-
151
-
152
-
153
-
154
-
155
-
156
-
157
-
158
-
159
-
160
-
161
-
162
-
163
-
164
-
165
-
166
-
167
-
168
-
169
-
170
-
171
-
172
-
173
-
174
-
175
-
176
-
177
-
178
-
179
-
180
-
181
-
182
-
183
-
184
-
185
-
186
-
187
-
188
-
189
-
190
-
191
-
192
-
193
-
194
-
195
-
196
-
197
-
198
-
199
-
200
-
201
-
202
-
203
-
204
-
205
-
206
-
207
-
208
-
209
-
210
-
211
-
212
-
213
-
214
-
215
-
216
-
217
-
218
-
219
-
220
-
221
-
222
-
223
-
224
-
225
-
226
-
227
-
228
-
229
-
230
-
231
-
232
-
233
-
234
-
235
-
236
-
237
-
238
-
239
-
240
-
241
-
242
-
243
-
244
-
245
-
246
-
247
-
248
-
249
-
250
-
251
-
252
-
253
-
254
-
255
-
256
-
257
-
258
-
259
-
260
-
261
-
262
-
263
-
264
 |
 |

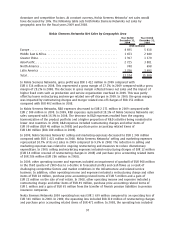
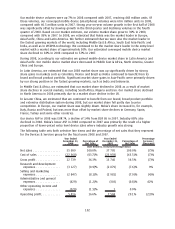
NAVTEQ net sales for the period from July 10, 2008 to December 31, 2008 were EUR 361 million. Net
sales were driven by the licensing of NAVTEQ’s geographic database and related locationbased
content. The following table sets forth NAVTEQ net sales by geographic area for the period from
July 10, 2008 to December 31, 2008.
From July 10 to
December 31,
2008
(EUR millions)
Europe ................................................................. 158
Middle East & Africa ...................................................... 29
China .................................................................. 2
AsiaPacific ............................................................. 10
North America ........................................................... 155
Latin America ........................................................... 7
Total................................................................... 361
For the period from July 10, 2008 to December 31, 2008, NAVTEQ gross profit was EUR 318 million.
Gross profit reflects net sales, partially offset by costs related to the delivery of NAVTEQ’s database
information to its customers.
NAVTEQ R&D expenses for the period from July 10, 2008 to December 31, 2008 were EUR 332 million.
NAVTEQ R&D expenses included amortization of intangible assets recorded as part of Nokia’s
acquisition of NAVTEQ totaling EUR 171 million. R&D expenses were also driven by increased
investment in NAVTEQ’s map database related to geographic expansion and quality improvements.
R&D expenses represented 92.0% of NAVTEQ net sales for this period.
For the period from July 10, 2008 to December 31, 2008, NAVTEQ’s selling and marketing expenses
were EUR 109 million. NAVTEQ’s selling and marketing expenses primarily consisted of amortization of
intangible assets recorded as part of Nokia’s acquisition of NAVTEQ totaling EUR 57 million. Selling
and marketing expenses were also driven by investments to grow NAVTEQ’s worldwide sales force
and expand the breadth of its product offerings. Selling and marketing expenses represented 30.2%
of NAVTEQ net sales for this period.
NAVTEQ operating loss was EUR 153 million for the period from July 10, 2008 to December 31, 2008,
with an operating margin of negative 42.4%. The operating loss was primarily the result of the
amortization of intangible assets recorded as part of Nokia’s acquisition of NAVTEQ, which was
partially offset by profits from NAVTEQ’s ongoing business.
Nokia Siemens Networks
According to our estimates, the mobile infrastructure market was flat in euro terms in 2008 compared
to 2007 with the trend varying, depending on region. Slowed growth in developed markets was due
to decreasing investments in mature 2G networks which were not fully offset by the capacity
expansions of 3G networks. The mobile infrastructure market still grew in emerging markets such as
Middle East & Africa, Latin America and China due to the continued subscriber growth, resulting in
traffic and correlating capacity increases as well as new network buildouts. Globally, the volume
growth in the networks infrastructure equipment was significantly offset by the price erosion of the
equipment, largely as a result of maturing technologies and intense price competition. The fixed
infrastructure market continued to be characterized by intense price competition in 2008, both in
terms of the equipment price erosion due to heavy competition, especially from Asian vendors, and
declining tariffs.
104