Nokia 2009 Annual Report Download - page 243
Download and view the complete annual report
Please find page 243 of the 2009 Nokia annual report below. You can navigate through the pages in the report by either clicking on the pages listed below, or by using the keyword search tool below to find specific information within the annual report.-
 1
1 -
2
-
3
-
4
-
5
-
6
-
7
-
8
-
9
-
10
-
11
-
12
-
13
-
14
-
15
-
16
-
17
-
18
-
19
-
20
-
21
-
22
-
23
-
24
-
25
-
26
-
27
-
28
-
29
-
30
-
31
-
32
-
33
-
34
-
35
-
36
-
37
-
38
-
39
-
40
-
41
-
42
-
43
-
44
-
45
-
46
-
47
-
48
-
49
-
50
-
51
-
52
-
53
-
54
-
55
-
56
-
57
-
58
-
59
-
60
-
61
-
62
-
63
-
64
-
65
-
66
-
67
-
68
-
69
-
70
-
71
-
72
-
73
-
74
-
75
-
76
-
77
-
78
-
79
-
80
-
81
-
82
-
83
-
84
-
85
-
86
-
87
-
88
-
89
-
90
-
91
-
92
-
93
-
94
-
95
-
96
-
97
-
98
-
99
-
100
-
101
-
102
-
103
-
104
-
105
-
106
-
107
-
108
-
109
-
110
-
111
-
112
-
113
-
114
-
115
-
116
-
117
-
118
-
119
-
120
-
121
-
122
-
123
-
124
-
125
-
126
-
127
-
128
-
129
-
130
-
131
-
132
-
133
-
134
-
135
-
136
-
137
-
138
-
139
-
140
-
141
-
142
-
143
-
144
-
145
-
146
-
147
-
148
-
149
-
150
-
151
-
152
-
153
-
154
-
155
-
156
-
157
-
158
-
159
-
160
-
161
-
162
-
163
-
164
-
165
-
166
-
167
-
168
-
169
-
170
-
171
-
172
-
173
-
174
-
175
-
176
-
177
-
178
-
179
-
180
-
181
-
182
-
183
-
184
-
185
-
186
-
187
-
188
-
189
-
190
-
191
-
192
-
193
-
194
-
195
-
196
-
197
-
198
-
199
-
200
-
201
-
202
-
203
-
204
-
205
-
206
-
207
-
208
-
209
-
210
-
211
-
212
-
213
-
214
-
215
-
216
-
217
-
218
-
219
-
220
-
221
-
222
-
223
-
224
-
225
-
226
-
227
-
228
-
229
-
230
-
231
-
232
-
 233
233 -
 234
234 -
 235
235 -
 236
236 -
 237
237 -
 238
238 -
 239
239 -
 240
240 -
 241
241 -
 242
242 -
 243
243 -
 244
244 -
 245
245 -
 246
246 -
 247
247 -
 248
248 -
 249
249 -
 250
250 -
 251
251 -
 252
252 -
 253
253 -
254
-
255
-
256
-
257
-
258
-
259
-
260
-
261
-
262
-
263
-
264
 |
 |

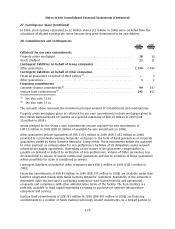
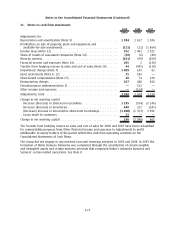
26. Provisions (Continued)
2008, resulting from the Group’s decision to discontinue the production of mobile devices in
Germany, a restructuring provision of EUR 259 million was recognized. Devices and Services also
recognized EUR 52 million related to other restructuring activities.
Restructuring and other associated expenses incurred in Nokia Siemens Networks in 2009 totaled
EUR 310 million (EUR 646 million in 2008) including mainly personnel related expenses as well as
expenses arising from the elimination of overlapping functions, and the realignment of product
portfolio and related replacement of discontinued products in customer sites. These expenses
included EUR 151 million (EUR 402 million in 2008) impacting gross profit, EUR 30 million (EUR
46 million in 2008) research and development expenses, EUR 12 million (reversal of provision
EUR 14 million in 2008) in selling and marketing expenses, EUR 103 million (EUR 163 million in
2008) administrative expenses and EUR 14 million (EUR 49 million in 2008) other operating expenses.
EUR 514 million was paid during 2009 (EUR 790 million during 2008).
Provisions for losses on projects in progress are related to Nokia Siemens Networks’ onerous
contracts.
The IPR provision is based on estimated future settlements for asserted and unasserted past IPR
infringements. Final resolution of IPR claims generally occurs over several periods. In 2008,
EUR 379 million usage of the provisions mainly relates to the settlements with Qualcomm, Eastman
Kodak, Intertrust Technologies and ContentGuard.
Other provisions include provisions for noncancelable purchase commitments, product portfolio
provisions for the alignment of the product portfolio and related replacement of discontinued
products in customer sites and provision for pension and other social security costs on sharebased
awards.
27. Earnings per share
2009 2008 2007
Numerator/EURm
Basic/Diluted:
Profit attributable to equity holders of the parent ....... 891 3 988 7 205
Denominator/1 000 shares
Basic:
Weighted average shares ........................... 3 705 116 3 743 622 3 885 408
Effect of dilutive securities:
Performance shares ............................. 9 614 25 997 26 304
Restricted shares................................ 6 341 6 543 3 693
Stock options .................................. 14 201 16 603
15 956 36 741 46 600
Diluted:
Adjusted weighted average shares and assumed
conversions .................................... 3 721 072 3 780 363 3 932 008
Under IAS 33, basic earnings per share is computed using the weighted average number of shares
outstanding during the period. Diluted earnings per share is computed using the weighted average
number of shares outstanding during the period plus the dilutive effect of stock options, restricted
shares and performance shares outstanding during the period.
F69
Notes to the Consolidated Financial Statements (Continued)