Nokia 2009 Annual Report Download - page 105
Download and view the complete annual report
Please find page 105 of the 2009 Nokia annual report below. You can navigate through the pages in the report by either clicking on the pages listed below, or by using the keyword search tool below to find specific information within the annual report.-
 1
1 -
2
-
3
-
4
-
5
-
6
-
7
-
8
-
9
-
10
-
11
-
12
-
13
-
14
-
15
-
16
-
17
-
18
-
19
-
20
-
21
-
22
-
23
-
24
-
25
-
26
-
27
-
28
-
29
-
30
-
31
-
32
-
33
-
34
-
35
-
36
-
37
-
38
-
39
-
40
-
41
-
42
-
43
-
44
-
45
-
46
-
47
-
48
-
49
-
50
-
51
-
52
-
53
-
54
-
55
-
56
-
57
-
58
-
59
-
60
-
61
-
62
-
63
-
64
-
65
-
66
-
67
-
68
-
69
-
70
-
71
-
72
-
73
-
74
-
75
-
76
-
77
-
78
-
79
-
80
-
81
-
82
-
83
-
84
-
85
-
86
-
87
-
88
-
89
-
90
-
91
-
92
-
93
-
94
-
 95
95 -
 96
96 -
 97
97 -
 98
98 -
 99
99 -
 100
100 -
 101
101 -
 102
102 -
 103
103 -
 104
104 -
 105
105 -
 106
106 -
 107
107 -
 108
108 -
 109
109 -
 110
110 -
 111
111 -
 112
112 -
 113
113 -
 114
114 -
 115
115 -
116
-
117
-
118
-
119
-
120
-
121
-
122
-
123
-
124
-
125
-
126
-
127
-
128
-
129
-
130
-
131
-
132
-
133
-
134
-
135
-
136
-
137
-
138
-
139
-
140
-
141
-
142
-
143
-
144
-
145
-
146
-
147
-
148
-
149
-
150
-
151
-
152
-
153
-
154
-
155
-
156
-
157
-
158
-
159
-
160
-
161
-
162
-
163
-
164
-
165
-
166
-
167
-
168
-
169
-
170
-
171
-
172
-
173
-
174
-
175
-
176
-
177
-
178
-
179
-
180
-
181
-
182
-
183
-
184
-
185
-
186
-
187
-
188
-
189
-
190
-
191
-
192
-
193
-
194
-
195
-
196
-
197
-
198
-
199
-
200
-
201
-
202
-
203
-
204
-
205
-
206
-
207
-
208
-
209
-
210
-
211
-
212
-
213
-
214
-
215
-
216
-
217
-
218
-
219
-
220
-
221
-
222
-
223
-
224
-
225
-
226
-
227
-
228
-
229
-
230
-
231
-
232
-
233
-
234
-
235
-
236
-
237
-
238
-
239
-
240
-
241
-
242
-
243
-
244
-
245
-
246
-
247
-
248
-
249
-
250
-
251
-
252
-
253
-
254
-
255
-
256
-
257
-
258
-
259
-
260
-
261
-
262
-
263
-
264
 |
 |

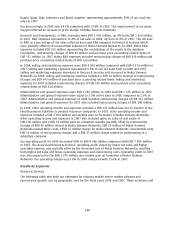
Devices & Services net sales in 2008 decreased 7% to EUR 35 099 million compared with
EUR 37 705 million in 2007. The net sales decrease was primarily due to strong volume growth in the
first half of 2008 being significantly offset by slowing growth in the third quarter and declining
volumes in the fourth quarter of 2008. Further, the overall volume growth in 2008 was more than
offset by a decline in ASP. Net sales grew in Latin America. Net sales decreased in North America,
Europe, Middle East & Africa, AsiaPacific and Greater China. In 2008, services and software net sales
contributed EUR 476 million of our total Device & Services net sales.
Devices & Services gross profit in 2008 was EUR 12 739 million compared with EUR 13 746 million in
2007. This represented a gross margin of 36.3% in 2008 compared with a gross margin of 36.5% in
2007.
Devices & Services R&D expenses in 2008 increased by 9% to EUR 3 127 million compared with
EUR 2 879 million in 2007. In 2008, R&D expenses represented 8.9% of Devices & Services net sales
compared with 7.6% in 2007. The increase was mainly driven by further investments in software and
services. In 2008, Devices & Services R&D expenses included EUR 153 million representing the
contribution of the assets to the Symbian Foundation.
In 2008, Devices & Services selling and marketing expenses decreased by 4% to EUR 2 847 million
primarily as a result of increased focus on costefficiency of its selling and marketing efforts,
compared with EUR 2 981 million in 2007. In 2008, selling and marketing expenses represented 8.1%
of Devices & Services net sales compared with 7.9% of its net sales in 2007.
Other operating income and expenses were EUR 520 million in 2008 and included EUR 392 million of
restructuring charges primarily related to the closure of the Bochum site in Germany. In 2007, other
operating income and expenses included EUR 57 million of restructuring charges and a EUR 53 million
gain on business transfer.
In 2008, Devices & Services operating profit decreased 23% to EUR 5 816 million compared with
EUR 7 584 million in 2007, with a 16.6% operating margin, down from 20.1% in 2007. The decrease
in operating profit in 2008 was primarily driven by lower net sales and higher operating expenses
compared to 2007.
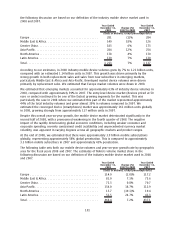
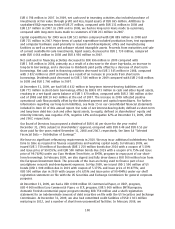
NAVTEQ
The following table sets forth selective line items and the percentage of net sales that they represent
for NAVTEQ for the period from July 10, 2008 to December 31, 2008.
From July 10 to
December 31,
2008
Percentage of
Net Sales
(EUR millions, except
percentage data)
Net sales ................................................... 361 100.0%
Cost of sales ................................................ (43) (11.9)%
Gross profit ................................................. 318 88.1%
Research and development expenses ............................ (332) (92.0)%
Selling and marketing expenses ................................ (109) (30.2)%
Administrative and general expenses ............................ (30) (8.3)%
Other operating income and expenses ........................... — 0.0%
Operating profit ............................................. (153) (42.4)%
103