Nokia 2009 Annual Report Download - page 255
Download and view the complete annual report
Please find page 255 of the 2009 Nokia annual report below. You can navigate through the pages in the report by either clicking on the pages listed below, or by using the keyword search tool below to find specific information within the annual report.-
 1
1 -
2
-
3
-
4
-
5
-
6
-
7
-
8
-
9
-
10
-
11
-
12
-
13
-
14
-
15
-
16
-
17
-
18
-
19
-
20
-
21
-
22
-
23
-
24
-
25
-
26
-
27
-
28
-
29
-
30
-
31
-
32
-
33
-
34
-
35
-
36
-
37
-
38
-
39
-
40
-
41
-
42
-
43
-
44
-
45
-
46
-
47
-
48
-
49
-
50
-
51
-
52
-
53
-
54
-
55
-
56
-
57
-
58
-
59
-
60
-
61
-
62
-
63
-
64
-
65
-
66
-
67
-
68
-
69
-
70
-
71
-
72
-
73
-
74
-
75
-
76
-
77
-
78
-
79
-
80
-
81
-
82
-
83
-
84
-
85
-
86
-
87
-
88
-
89
-
90
-
91
-
92
-
93
-
94
-
95
-
96
-
97
-
98
-
99
-
100
-
101
-
102
-
103
-
104
-
105
-
106
-
107
-
108
-
109
-
110
-
111
-
112
-
113
-
114
-
115
-
116
-
117
-
118
-
119
-
120
-
121
-
122
-
123
-
124
-
125
-
126
-
127
-
128
-
129
-
130
-
131
-
132
-
133
-
134
-
135
-
136
-
137
-
138
-
139
-
140
-
141
-
142
-
143
-
144
-
145
-
146
-
147
-
148
-
149
-
150
-
151
-
152
-
153
-
154
-
155
-
156
-
157
-
158
-
159
-
160
-
161
-
162
-
163
-
164
-
165
-
166
-
167
-
168
-
169
-
170
-
171
-
172
-
173
-
174
-
175
-
176
-
177
-
178
-
179
-
180
-
181
-
182
-
183
-
184
-
185
-
186
-
187
-
188
-
189
-
190
-
191
-
192
-
193
-
194
-
195
-
196
-
197
-
198
-
199
-
200
-
201
-
202
-
203
-
204
-
205
-
206
-
207
-
208
-
209
-
210
-
211
-
212
-
213
-
214
-
215
-
216
-
217
-
218
-
219
-
220
-
221
-
222
-
223
-
224
-
225
-
226
-
227
-
228
-
229
-
230
-
231
-
232
-
233
-
234
-
235
-
236
-
237
-
238
-
239
-
240
-
241
-
242
-
243
-
244
-
 245
245 -
 246
246 -
 247
247 -
 248
248 -
 249
249 -
 250
250 -
 251
251 -
 252
252 -
 253
253 -
 254
254 -
 255
255 -
 256
256 -
 257
257 -
 258
258 -
 259
259 -
 260
260 -
 261
261 -
 262
262 -
 263
263 -
 264
264
 |
 |

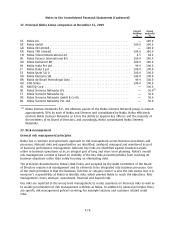
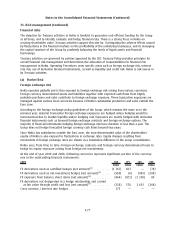
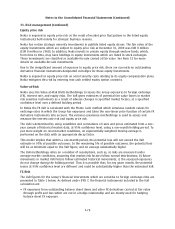
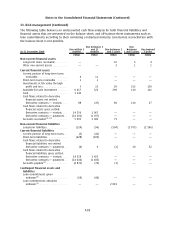
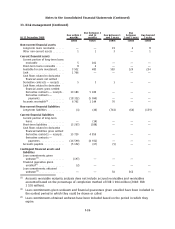
33. Risk management (Continued)
Business Related Credit Risk
The Company aims to ensure highest possible quality in accounts receivable and loans due from
customers and other third parties. The Group Credit Policy, approved by Group Executive Board, lays
out the framework for the management of the business related credit risks in all Nokia group
companies.
Credit exposure is measured as the total of accounts receivable and loans outstanding due from
customers and other third parties, and committed credits.
Group Credit Policy provides that credit decisions are based on credit evaluation including credit
rating for larger exposures. Nokia & Nokia Siemens Networks Rating Policy defines the rating
principles. Ratings are approved by Nokia & Nokia Siemens Networks Rating Committee. Credit risks
are approved and monitored according to the credit policy of each business entity. These policies are
based on the Group Credit Policy. Concentrations of customer or country risks are monitored at the
Nokia Group level. When appropriate, assumed credit risks are mitigated with the use of approved
instruments, such as collateral or insurance and sale of selected receivables.
The Group has provided impairment allowances as needed including on accounts receivable and loans
due from customers and other third parties not past due, based on the analysis of debtors’ credit
quality and credit history. The Group establishes an allowance for impairment that represents an
estimate of incurred losses. All receivables and loans due from customers and other third parties are
considered on an individual basis for impairment testing.
Top three customers account for approximately 2.2%, 2.2% and 1.9% (2008: 4.0%, 3.8% and 3.5%) of
Group accounts receivable and loans due from customers and other third parties as at 31 December,
2009, while the top three credit exposures by country amounted to 7.2%, 6.5% and 5.6% (2008:
8.5%, 7.2% and 7.2%), respectively.
As at 31 December, 2009, the carrying amount before deducting any impairment allowance of
accounts receivable relating to customers for which an impairment was provided amounted to
EUR 2 528 million (2008: EUR 3 042 million). The amount of provision taken against that portion of
these receivables considered to be impaired was EUR 391 million (2008: EUR 415 million) (see also
note 19 Valuation and qualifying accounts).
An amount of EUR 679 million (2008: EUR 729 million) relates to past due receivables from customers
for which no impairment loss was recognized. The aging of these receivables is as follows:
2009 2008
EURm EURm
Past due 130 days ....................................................... 393 453
Past due 31180 days ..................................................... 170 240
More than 180 days....................................................... 116 36
679 729
The carrying amount of accounts receivable that would otherwise be past due or impaired but whose
terms have been renegotiated was EUR 36 million (EUR 0 million in 2008).
As at 31 December, 2009, the carrying amount before deducting any impairment allowance of loans
due from customers and other third parties for which impairment was provided amounted to
EUR 4 million (2008: EUR 4 million). The amount of provision taken for these loans was EUR 4 million
(2008: EUR 4 million).
There were no past due loans from customers and other third parties.
F81
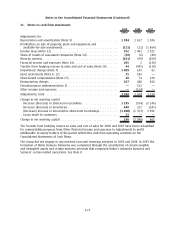
Notes to the Consolidated Financial Statements (Continued)