Nokia 2009 Annual Report Download - page 206
Download and view the complete annual report
Please find page 206 of the 2009 Nokia annual report below. You can navigate through the pages in the report by either clicking on the pages listed below, or by using the keyword search tool below to find specific information within the annual report.-
 1
1 -
2
-
3
-
4
-
5
-
6
-
7
-
8
-
9
-
10
-
11
-
12
-
13
-
14
-
15
-
16
-
17
-
18
-
19
-
20
-
21
-
22
-
23
-
24
-
25
-
26
-
27
-
28
-
29
-
30
-
31
-
32
-
33
-
34
-
35
-
36
-
37
-
38
-
39
-
40
-
41
-
42
-
43
-
44
-
45
-
46
-
47
-
48
-
49
-
50
-
51
-
52
-
53
-
54
-
55
-
56
-
57
-
58
-
59
-
60
-
61
-
62
-
63
-
64
-
65
-
66
-
67
-
68
-
69
-
70
-
71
-
72
-
73
-
74
-
75
-
76
-
77
-
78
-
79
-
80
-
81
-
82
-
83
-
84
-
85
-
86
-
87
-
88
-
89
-
90
-
91
-
92
-
93
-
94
-
95
-
96
-
97
-
98
-
99
-
100
-
101
-
102
-
103
-
104
-
105
-
106
-
107
-
108
-
109
-
110
-
111
-
112
-
113
-
114
-
115
-
116
-
117
-
118
-
119
-
120
-
121
-
122
-
123
-
124
-
125
-
126
-
127
-
128
-
129
-
130
-
131
-
132
-
133
-
134
-
135
-
136
-
137
-
138
-
139
-
140
-
141
-
142
-
143
-
144
-
145
-
146
-
147
-
148
-
149
-
150
-
151
-
152
-
153
-
154
-
155
-
156
-
157
-
158
-
159
-
160
-
161
-
162
-
163
-
164
-
165
-
166
-
167
-
168
-
169
-
170
-
171
-
172
-
173
-
174
-
175
-
176
-
177
-
178
-
179
-
180
-
181
-
182
-
183
-
184
-
185
-
186
-
187
-
188
-
189
-
190
-
191
-
192
-
193
-
194
-
195
-
 196
196 -
 197
197 -
 198
198 -
 199
199 -
 200
200 -
 201
201 -
 202
202 -
 203
203 -
 204
204 -
 205
205 -
 206
206 -
 207
207 -
 208
208 -
 209
209 -
 210
210 -
 211
211 -
 212
212 -
 213
213 -
 214
214 -
 215
215 -
 216
216 -
217
-
218
-
219
-
220
-
221
-
222
-
223
-
224
-
225
-
226
-
227
-
228
-
229
-
230
-
231
-
232
-
233
-
234
-
235
-
236
-
237
-
238
-
239
-
240
-
241
-
242
-
243
-
244
-
245
-
246
-
247
-
248
-
249
-
250
-
251
-
252
-
253
-
254
-
255
-
256
-
257
-
258
-
259
-
260
-
261
-
262
-
263
-
264
 |
 |

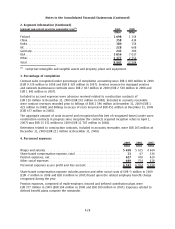
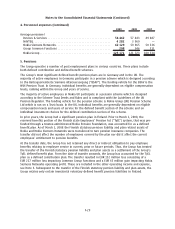
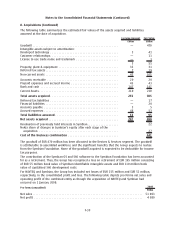
5. Pensions (Continued)
The expected longterm rate of return on plan assets is based on the expected return multiplied with
the respective percentage weight of the marketrelated value of plan assets. The expected return is
defined on a uniform basis, reflecting longterm historical returns, current market conditions and
strategic asset allocation.
The Groups’s pension plan weighted average asset allocation as a percentage of Plan Assets at
December 31, 2009, and 2008, by asset category are as follows:
2009 2008
%%
Asset category:
Equity securities ........................................................... 21 12
Debt securities ............................................................ 65 72
Insurance contracts ........................................................ 88
Real estate . . . ............................................................ 11
Shortterm investments ..................................................... 57
Total .................................................................... 100 100
The objective of the investment activities is to maximize the excess of plan assets over projected
benefit obligations, within an accepted risk level, taking into account the interest rate and inflation
sensitivity of the assets as well as the obligations.
The Pension Committee of the Group, consisting of the Head of Treasury, Head of HR and other HR
representatives, approves both the target asset allocation as well as the deviation limit. Derivative
instruments can be used to change the portfolio asset allocation and risk characteristics.
The foreign pension plan assets include a self investment through a loan provided to Nokia by the
Group’s German pension fund of EUR 69 million (EUR 69 million in 2008). See Note 30.
The actual return on plan assets was EUR 126 million in 2009 (EUR 31 million in 2008).
In 2010, the Group expects to make contributions of EUR 69 million to its defined benefit pension plans.
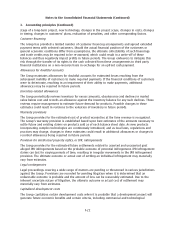
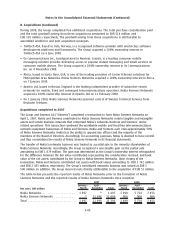
6. Other operating income and expenses
Other operating income for 2009 includes a gain on sale of security appliance business of
EUR 68 million impacting Devices & Services operating profit and a gain on sale of real estate in Oulu,
Finland, of EUR 22 million impacting Nokia Siemens Networks operating loss. In 2009, other operating
expenses includes EUR 178 million of charges related to restructuring activities in Devices & Services
due to measures taken to adjust the business operations and cost base according to market
conditions. In conjunction with the decision to refocus its activities around specified core assets,
Devices & Services recorded impairment charges totalling EUR 56 million for intangible assets arising
from the acquisitions of Enpocket and Intellisync and the asset acquisition of Twango.
In 2008, other operating expenses include EUR 152 million net loss on transfer of Finnish pension
liabilities, of which a gain of EUR 65 million is included in Nokia Siemens Networks’ operating profit
and a loss of EUR 217 million in Corporate Common expenses. Devices & Services recorded
EUR 259 million of restructuring charges and EUR 81 million of impairment and other charges related
to closure of the Bochum site in Germany. Other operating expenses also include a charge of
EUR 52 million related to other restructuring activities in Devices & Services and EUR 49 million
charges related to restructuring and other costs in Nokia Siemens Networks.
Other operating income for 2007 includes a nontaxable gain of EUR 1 879 million relating to the
formation of Nokia Siemens Networks. Other operating income also includes gain on sale of real
estates in Finland of EUR 128 million, of which EUR 75 million is included in Common functions’
F32
Notes to the Consolidated Financial Statements (Continued)