Nokia 2009 Annual Report Download - page 227
Download and view the complete annual report
Please find page 227 of the 2009 Nokia annual report below. You can navigate through the pages in the report by either clicking on the pages listed below, or by using the keyword search tool below to find specific information within the annual report.-
 1
1 -
2
-
3
-
4
-
5
-
6
-
7
-
8
-
9
-
10
-
11
-
12
-
13
-
14
-
15
-
16
-
17
-
18
-
19
-
20
-
21
-
22
-
23
-
24
-
25
-
26
-
27
-
28
-
29
-
30
-
31
-
32
-
33
-
34
-
35
-
36
-
37
-
38
-
39
-
40
-
41
-
42
-
43
-
44
-
45
-
46
-
47
-
48
-
49
-
50
-
51
-
52
-
53
-
54
-
55
-
56
-
57
-
58
-
59
-
60
-
61
-
62
-
63
-
64
-
65
-
66
-
67
-
68
-
69
-
70
-
71
-
72
-
73
-
74
-
75
-
76
-
77
-
78
-
79
-
80
-
81
-
82
-
83
-
84
-
85
-
86
-
87
-
88
-
89
-
90
-
91
-
92
-
93
-
94
-
95
-
96
-
97
-
98
-
99
-
100
-
101
-
102
-
103
-
104
-
105
-
106
-
107
-
108
-
109
-
110
-
111
-
112
-
113
-
114
-
115
-
116
-
117
-
118
-
119
-
120
-
121
-
122
-
123
-
124
-
125
-
126
-
127
-
128
-
129
-
130
-
131
-
132
-
133
-
134
-
135
-
136
-
137
-
138
-
139
-
140
-
141
-
142
-
143
-
144
-
145
-
146
-
147
-
148
-
149
-
150
-
151
-
152
-
153
-
154
-
155
-
156
-
157
-
158
-
159
-
160
-
161
-
162
-
163
-
164
-
165
-
166
-
167
-
168
-
169
-
170
-
171
-
172
-
173
-
174
-
175
-
176
-
177
-
178
-
179
-
180
-
181
-
182
-
183
-
184
-
185
-
186
-
187
-
188
-
189
-
190
-
191
-
192
-
193
-
194
-
195
-
196
-
197
-
198
-
199
-
200
-
201
-
202
-
203
-
204
-
205
-
206
-
207
-
208
-
209
-
210
-
211
-
212
-
213
-
214
-
215
-
216
-
 217
217 -
 218
218 -
 219
219 -
 220
220 -
 221
221 -
 222
222 -
 223
223 -
 224
224 -
 225
225 -
 226
226 -
 227
227 -
 228
228 -
 229
229 -
 230
230 -
 231
231 -
 232
232 -
 233
233 -
 234
234 -
 235
235 -
 236
236 -
 237
237 -
238
-
239
-
240
-
241
-
242
-
243
-
244
-
245
-
246
-
247
-
248
-
249
-
250
-
251
-
252
-
253
-
254
-
255
-
256
-
257
-
258
-
259
-
260
-
261
-
262
-
263
-
264
 |
 |

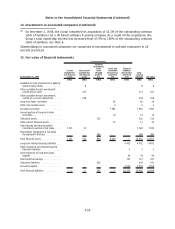
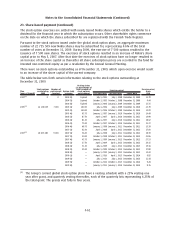
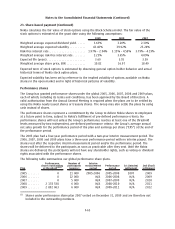
15. Fair value of financial instruments (Continued)
The following table shows a reconciliation of the opening and closing recorded amount of Level 3
financial assets and liabilities which are measured at fair value:
EURm
Other available
forsale
investments
carried at
fair value
Balance at December 31, 2008 ............................................ 214
Total gains/(losses) in income statement ..................................... (30)
Total gains/(losses) recorded in other comprehensive income ..................... 15
Purchases .............................................................. 45
Sales .................................................................. (2)
Transfer from level 1 and 2 ................................................ —
At December 31, 2009 ................................................... 242
The gains and losses from Level 3 financial instruments are included in the line other operating
expenses of the profit and loss for the period. A net loss of EUR 14 million related to Level 3 financial
instruments held at December 31, 2009, was included in the profit and loss during 2009.
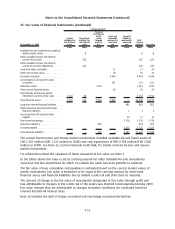
16. Derivative financial instruments
2009 Fair value
(1)
Notional
(2)
Fair value
(1)
Notional
(2)
Assets Liabilities
EURm EURm EURm EURm
Hedges of net investment in foreign subsidiaries:
Forward foreign exchange contracts ........... 12 1128 (42) 2317
Cash flow hedges:
Forward foreign exchange contracts ........... 25 8062 (25) 7027
Interest rate swaps......................... — — (2) 330
Fair value hedges
Interest rate swaps......................... 117 1750 (10) 68
Cash flow and Fair value hedges:
(4)
Cross currency interest rate swaps ............. — — (77) 416
Derivatives not designated in hedge accounting
relationships carried at fair value through profit
and loss:
Forward foreign exchange contracts ........... 147 5785 (68) 6504
Currency options bought .................... 8 442 — —
Currency options sold ....................... — — (1) 102
Interest rate swaps......................... 7 68 (20) 499
Cash settled equity options bought
(3)
.......... — 6 — —
316 17 241 (245) 17 263
F53
Notes to the Consolidated Financial Statements (Continued)