Nokia 2009 Annual Report Download - page 9
Download and view the complete annual report
Please find page 9 of the 2009 Nokia annual report below. You can navigate through the pages in the report by either clicking on the pages listed below, or by using the keyword search tool below to find specific information within the annual report.-
 1
1 -
 2
2 -
 3
3 -
 4
4 -
 5
5 -
 6
6 -
 7
7 -
 8
8 -
 9
9 -
 10
10 -
 11
11 -
 12
12 -
 13
13 -
 14
14 -
 15
15 -
 16
16 -
 17
17 -
 18
18 -
 19
19 -
 20
20 -
21
-
22
-
23
-
24
-
25
-
26
-
27
-
28
-
29
-
30
-
31
-
32
-
33
-
34
-
35
-
36
-
37
-
38
-
39
-
40
-
41
-
42
-
43
-
44
-
45
-
46
-
47
-
48
-
49
-
50
-
51
-
52
-
53
-
54
-
55
-
56
-
57
-
58
-
59
-
60
-
61
-
62
-
63
-
64
-
65
-
66
-
67
-
68
-
69
-
70
-
71
-
72
-
73
-
74
-
75
-
76
-
77
-
78
-
79
-
80
-
81
-
82
-
83
-
84
-
85
-
86
-
87
-
88
-
89
-
90
-
91
-
92
-
93
-
94
-
95
-
96
-
97
-
98
-
99
-
100
-
101
-
102
-
103
-
104
-
105
-
106
-
107
-
108
-
109
-
110
-
111
-
112
-
113
-
114
-
115
-
116
-
117
-
118
-
119
-
120
-
121
-
122
-
123
-
124
-
125
-
126
-
127
-
128
-
129
-
130
-
131
-
132
-
133
-
134
-
135
-
136
-
137
-
138
-
139
-
140
-
141
-
142
-
143
-
144
-
145
-
146
-
147
-
148
-
149
-
150
-
151
-
152
-
153
-
154
-
155
-
156
-
157
-
158
-
159
-
160
-
161
-
162
-
163
-
164
-
165
-
166
-
167
-
168
-
169
-
170
-
171
-
172
-
173
-
174
-
175
-
176
-
177
-
178
-
179
-
180
-
181
-
182
-
183
-
184
-
185
-
186
-
187
-
188
-
189
-
190
-
191
-
192
-
193
-
194
-
195
-
196
-
197
-
198
-
199
-
200
-
201
-
202
-
203
-
204
-
205
-
206
-
207
-
208
-
209
-
210
-
211
-
212
-
213
-
214
-
215
-
216
-
217
-
218
-
219
-
220
-
221
-
222
-
223
-
224
-
225
-
226
-
227
-
228
-
229
-
230
-
231
-
232
-
233
-
234
-
235
-
236
-
237
-
238
-
239
-
240
-
241
-
242
-
243
-
244
-
245
-
246
-
247
-
248
-
249
-
250
-
251
-
252
-
253
-
254
-
255
-
256
-
257
-
258
-
259
-
260
-
261
-
262
-
263
-
264
 |
 |

PART I
ITEM 1. IDENTITY OF DIRECTORS, SENIOR MANAGEMENT AND ADVISERS
Not applicable.
ITEM 2. OFFER STATISTICS AND EXPECTED TIMETABLE
Not applicable.
ITEM 3. KEY INFORMATION
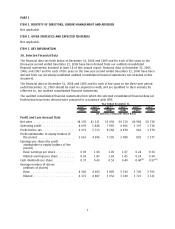
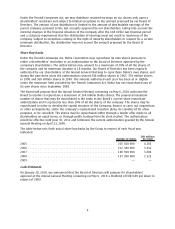
3A. Selected Financial Data
The financial data set forth below at December 31, 2008 and 2009 and for each of the years in the
threeyear period ended December 31, 2009 have been derived from our audited consolidated
financial statements included in Item 18 of this annual report. Financial data at December 31, 2005,
2006, and 2007 and for each of the years in the twoyear period ended December 31, 2006 have been
derived from our previously published audited consolidated financial statements not included in this
document.
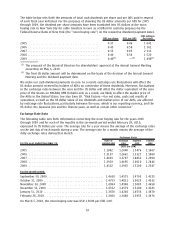
The financial data at December 31, 2008 and 2009 and for each of the years in the threeyear period
ended December 31, 2009 should be read in conjunction with, and are qualified in their entirety by
reference to, our audited consolidated financial statements.
The audited consolidated financial statements from which the selected consolidated financial data set
forth below have been derived were prepared in accordance with IFRS.
2005
(1)
2006
(1)
2007
(1)
2008
(1)
2009
(1)
2009
(1)
Year Ended December 31,
(EUR) (EUR) (EUR) (EUR) (EUR) (USD)
(in millions, except per share data)
Profit and Loss Account Data
Net sales . ......................... 34191 41121 51058 50710 40984 58738
Operating profit .................... 4639 5488 7985 4966 1197 1716
Profit before tax .................... 4971 5723 8268 4970 962 1379
Profit attributable to equity holders of
theparent....................... 3616 4306 7205 3988 891 1277
Earnings per share (for profit
attributable to equity holders of the
parent)
Basic earnings per share ............ 0.83 1.06 1.85 1.07 0.24 0.34
Diluted earnings per share .......... 0.83 1.05 1.83 1.05 0.24 0.34
Cash dividends per share ............. 0.37 0.43 0.53 0.40 0.40
(2)
0.57
(2)
Average number of shares
(millions of shares)
Basic . . ......................... 4366 4063 3885 3744 3705 3705
Diluted . ......................... 4371 4087 3932 3780 3721 3721
7