Nokia 2009 Annual Report Download - page 226
Download and view the complete annual report
Please find page 226 of the 2009 Nokia annual report below. You can navigate through the pages in the report by either clicking on the pages listed below, or by using the keyword search tool below to find specific information within the annual report.-
 1
1 -
2
-
3
-
4
-
5
-
6
-
7
-
8
-
9
-
10
-
11
-
12
-
13
-
14
-
15
-
16
-
17
-
18
-
19
-
20
-
21
-
22
-
23
-
24
-
25
-
26
-
27
-
28
-
29
-
30
-
31
-
32
-
33
-
34
-
35
-
36
-
37
-
38
-
39
-
40
-
41
-
42
-
43
-
44
-
45
-
46
-
47
-
48
-
49
-
50
-
51
-
52
-
53
-
54
-
55
-
56
-
57
-
58
-
59
-
60
-
61
-
62
-
63
-
64
-
65
-
66
-
67
-
68
-
69
-
70
-
71
-
72
-
73
-
74
-
75
-
76
-
77
-
78
-
79
-
80
-
81
-
82
-
83
-
84
-
85
-
86
-
87
-
88
-
89
-
90
-
91
-
92
-
93
-
94
-
95
-
96
-
97
-
98
-
99
-
100
-
101
-
102
-
103
-
104
-
105
-
106
-
107
-
108
-
109
-
110
-
111
-
112
-
113
-
114
-
115
-
116
-
117
-
118
-
119
-
120
-
121
-
122
-
123
-
124
-
125
-
126
-
127
-
128
-
129
-
130
-
131
-
132
-
133
-
134
-
135
-
136
-
137
-
138
-
139
-
140
-
141
-
142
-
143
-
144
-
145
-
146
-
147
-
148
-
149
-
150
-
151
-
152
-
153
-
154
-
155
-
156
-
157
-
158
-
159
-
160
-
161
-
162
-
163
-
164
-
165
-
166
-
167
-
168
-
169
-
170
-
171
-
172
-
173
-
174
-
175
-
176
-
177
-
178
-
179
-
180
-
181
-
182
-
183
-
184
-
185
-
186
-
187
-
188
-
189
-
190
-
191
-
192
-
193
-
194
-
195
-
196
-
197
-
198
-
199
-
200
-
201
-
202
-
203
-
204
-
205
-
206
-
207
-
208
-
209
-
210
-
211
-
212
-
213
-
214
-
215
-
 216
216 -
 217
217 -
 218
218 -
 219
219 -
 220
220 -
 221
221 -
 222
222 -
 223
223 -
 224
224 -
 225
225 -
 226
226 -
 227
227 -
 228
228 -
 229
229 -
 230
230 -
 231
231 -
 232
232 -
 233
233 -
 234
234 -
 235
235 -
 236
236 -
237
-
238
-
239
-
240
-
241
-
242
-
243
-
244
-
245
-
246
-
247
-
248
-
249
-
250
-
251
-
252
-
253
-
254
-
255
-
256
-
257
-
258
-
259
-
260
-
261
-
262
-
263
-
264
 |
 |

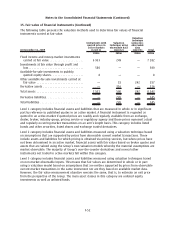
15. Fair value of financial instruments (Continued)
The following table presents the valuation methods used to determine fair values of financial
instruments carried at fair value:
At December 31, 2009
Instruments with
quoted prices in
active markets
(Level 1)
Valuation
technique using
observable data
(Level 2)
Valuation
technique
using non
observable
data
(Level 3) Total
EURm EURm EURm EURm
Fixed income and moneymarket investments
carried at fair value . .................... 6933 249 — 7182
Investments at fair value through profit and
loss .................................. 580 — — 580
Availableforsale investments in publicly
quoted equity shares .................... 8 — — 8
Other availableforsale investments carried at
fair value ............................. — 15 242 257
Derivative assets ......................... — 316 — 316
Total assets ............................. 7521 580 242 8343
Derivative liabilities . . . .................... — 245 — 245
Total liabilities ........................... — 245 — 245
Level 1 category includes financial assets and liabilities that are measured in whole or in significant
part by reference to published quotes in an active market. A financial instrument is regarded as
quoted in an active market if quoted prices are readily and regularly available from an exchange,
dealer, broker, industry group, pricing service or regulatory agency and those prices represent actual
and regularly occurring market transactions on an arm’s length basis. This category includes listed
bonds and other securities, listed shares and exchange traded derivatives.
Level 2 category includes financial assets and liabilities measured using a valuation technique based
on assumptions that are supported by prices from observable current market transactions. These
include assets and liabilities for which pricing is obtained via pricing services, but where prices have
not been determined in an active market, financial assets with fair values based on broker quotes and
assets that are valued using the Group’s own valuation models whereby the material assumptions are
market observable. The majority of Group’s overthecounter derivatives and several other
instruments not traded in active markets fall within this category.
Level 3 category includes financial assets and liabilities measured using valuation techniques based
on non market observable inputs. This means that fair values are determined in whole or in part
using a valuation model based on assumptions that are neither supported by prices from observable
current market transactions in the same instrument nor are they based on available market data.
However, the fair value measurement objective remains the same, that is, to estimate an exit price
from the perspective of the Group. The main asset classes in this category are unlisted equity
investments as well as unlisted funds.
F52
Notes to the Consolidated Financial Statements (Continued)