Nokia 2009 Annual Report Download - page 101
Download and view the complete annual report
Please find page 101 of the 2009 Nokia annual report below. You can navigate through the pages in the report by either clicking on the pages listed below, or by using the keyword search tool below to find specific information within the annual report.-
 1
1 -
2
-
3
-
4
-
5
-
6
-
7
-
8
-
9
-
10
-
11
-
12
-
13
-
14
-
15
-
16
-
17
-
18
-
19
-
20
-
21
-
22
-
23
-
24
-
25
-
26
-
27
-
28
-
29
-
30
-
31
-
32
-
33
-
34
-
35
-
36
-
37
-
38
-
39
-
40
-
41
-
42
-
43
-
44
-
45
-
46
-
47
-
48
-
49
-
50
-
51
-
52
-
53
-
54
-
55
-
56
-
57
-
58
-
59
-
60
-
61
-
62
-
63
-
64
-
65
-
66
-
67
-
68
-
69
-
70
-
71
-
72
-
73
-
74
-
75
-
76
-
77
-
78
-
79
-
80
-
81
-
82
-
83
-
84
-
85
-
86
-
87
-
88
-
89
-
90
-
 91
91 -
 92
92 -
 93
93 -
 94
94 -
 95
95 -
 96
96 -
 97
97 -
 98
98 -
 99
99 -
 100
100 -
 101
101 -
 102
102 -
 103
103 -
 104
104 -
 105
105 -
 106
106 -
 107
107 -
 108
108 -
 109
109 -
 110
110 -
 111
111 -
112
-
113
-
114
-
115
-
116
-
117
-
118
-
119
-
120
-
121
-
122
-
123
-
124
-
125
-
126
-
127
-
128
-
129
-
130
-
131
-
132
-
133
-
134
-
135
-
136
-
137
-
138
-
139
-
140
-
141
-
142
-
143
-
144
-
145
-
146
-
147
-
148
-
149
-
150
-
151
-
152
-
153
-
154
-
155
-
156
-
157
-
158
-
159
-
160
-
161
-
162
-
163
-
164
-
165
-
166
-
167
-
168
-
169
-
170
-
171
-
172
-
173
-
174
-
175
-
176
-
177
-
178
-
179
-
180
-
181
-
182
-
183
-
184
-
185
-
186
-
187
-
188
-
189
-
190
-
191
-
192
-
193
-
194
-
195
-
196
-
197
-
198
-
199
-
200
-
201
-
202
-
203
-
204
-
205
-
206
-
207
-
208
-
209
-
210
-
211
-
212
-
213
-
214
-
215
-
216
-
217
-
218
-
219
-
220
-
221
-
222
-
223
-
224
-
225
-
226
-
227
-
228
-
229
-
230
-
231
-
232
-
233
-
234
-
235
-
236
-
237
-
238
-
239
-
240
-
241
-
242
-
243
-
244
-
245
-
246
-
247
-
248
-
249
-
250
-
251
-
252
-
253
-
254
-
255
-
256
-
257
-
258
-
259
-
260
-
261
-
262
-
263
-
264
 |
 |

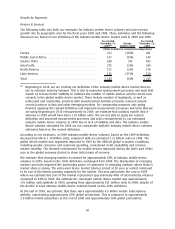
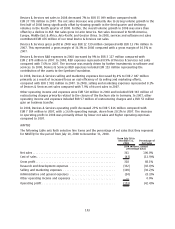
On July 10, 2008, Nokia completed the acquisition of NAVTEQ Corporation. NAVTEQ is a separate
reportable segment of Nokia starting from the third quarter 2008. Accordingly, the results of NAVTEQ
are available only for the period from July 10, 2008 to December 31, 2008.
As of April 1, 2007, Nokia results include those of Nokia Siemens Networks on a fully consolidated
basis. Nokia Siemens Networks, a company jointly owned by Nokia and Siemens, is comprised of the
former Nokia Networks and Siemens’ carrierrelated operations for fixed and mobile networks.
Accordingly, the results of Nokia Group and Nokia Siemens Networks for the full year 2008 are not
directly comparable to the results for the year ended December 31, 2007. The results from January 1,
2007 to March 31, 2007 included our former Networks business group only.
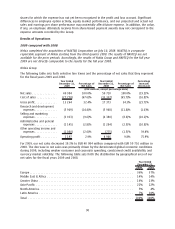
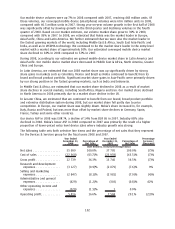
Nokia Group
The following table sets forth selective line items and the percentage of net sales that they represent
for the fiscal years 2008 and 2007.
Year Ended
December 31,
2008
Percentage of
Net Sales
Year Ended
December 31,
2007
Percentage of
Net Sales
Percentage
Increase/
(Decrease)
(EUR millions, except percentage data)
Net sales ................. 50710 100.0% 51 058 100.0% (1)%
Cost of sales .............. (33337) (65.7)% (33 781) (66.2)% (1)%
Gross profit ............... 17373 34.3% 17 277 33.8% 1%
Research and development
expenses ............... (5968) (11.8)% (5 636) (11.0)% 6%
Selling and marketing
expenses ............... (4380) (8.6)% (4 379) (8.6)% 0%
Administrative and general
expenses ............... (1284) (2.5)% (1 165) (2.3)% 10%
Other operating income and
expenses ............... (775) (1.5)% 1 888 3.7%
Operating profit............ 4966 9.8% 7985 15.6% (38)%
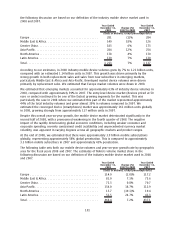
For 2008, our net sales decreased 1% to EUR 50 710 million compared with EUR 51 058 million in
2007. The decrease in net sales was driven by the decreased net sales in Devices & Services. The
following table sets forth the distribution by geographical area of our net sales for the fiscal years
2008 and 2007.
2008 2007
Year Ended
December 31,
Europe .................................................................. 37% 39%
Middle East & Africa ........................................................ 14% 14%
Greater China ............................................................. 13% 12%
AsiaPacific............................................................... 22% 22%
North America ............................................................ 4% 5%
Latin America............................................................. 10% 8%
Total .................................................................... 100% 100%
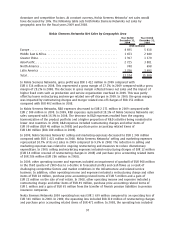
The 10 markets in which we generated the greatest net sales in 2008 were, in descending order of
magnitude, China, India, the UK, Germany, Russia, Indonesia, the US, Brazil, Italy and Spain, together
representing approximately 50% of our total net sales in 2008. In comparison, the 10 markets in
which we generated the greatest net sales in 2007 were China, India, Germany, the UK, the US,
99