Nokia 2009 Annual Report Download - page 96
Download and view the complete annual report
Please find page 96 of the 2009 Nokia annual report below. You can navigate through the pages in the report by either clicking on the pages listed below, or by using the keyword search tool below to find specific information within the annual report.-
 1
1 -
2
-
3
-
4
-
5
-
6
-
7
-
8
-
9
-
10
-
11
-
12
-
13
-
14
-
15
-
16
-
17
-
18
-
19
-
20
-
21
-
22
-
23
-
24
-
25
-
26
-
27
-
28
-
29
-
30
-
31
-
32
-
33
-
34
-
35
-
36
-
37
-
38
-
39
-
40
-
41
-
42
-
43
-
44
-
45
-
46
-
47
-
48
-
49
-
50
-
51
-
52
-
53
-
54
-
55
-
56
-
57
-
58
-
59
-
60
-
61
-
62
-
63
-
64
-
65
-
66
-
67
-
68
-
69
-
70
-
71
-
72
-
73
-
74
-
75
-
76
-
77
-
78
-
79
-
80
-
81
-
82
-
83
-
84
-
85
-
 86
86 -
 87
87 -
 88
88 -
 89
89 -
 90
90 -
 91
91 -
 92
92 -
 93
93 -
 94
94 -
 95
95 -
 96
96 -
 97
97 -
 98
98 -
 99
99 -
 100
100 -
 101
101 -
 102
102 -
 103
103 -
 104
104 -
 105
105 -
 106
106 -
107
-
108
-
109
-
110
-
111
-
112
-
113
-
114
-
115
-
116
-
117
-
118
-
119
-
120
-
121
-
122
-
123
-
124
-
125
-
126
-
127
-
128
-
129
-
130
-
131
-
132
-
133
-
134
-
135
-
136
-
137
-
138
-
139
-
140
-
141
-
142
-
143
-
144
-
145
-
146
-
147
-
148
-
149
-
150
-
151
-
152
-
153
-
154
-
155
-
156
-
157
-
158
-
159
-
160
-
161
-
162
-
163
-
164
-
165
-
166
-
167
-
168
-
169
-
170
-
171
-
172
-
173
-
174
-
175
-
176
-
177
-
178
-
179
-
180
-
181
-
182
-
183
-
184
-
185
-
186
-
187
-
188
-
189
-
190
-
191
-
192
-
193
-
194
-
195
-
196
-
197
-
198
-
199
-
200
-
201
-
202
-
203
-
204
-
205
-
206
-
207
-
208
-
209
-
210
-
211
-
212
-
213
-
214
-
215
-
216
-
217
-
218
-
219
-
220
-
221
-
222
-
223
-
224
-
225
-
226
-
227
-
228
-
229
-
230
-
231
-
232
-
233
-
234
-
235
-
236
-
237
-
238
-
239
-
240
-
241
-
242
-
243
-
244
-
245
-
246
-
247
-
248
-
249
-
250
-
251
-
252
-
253
-
254
-
255
-
256
-
257
-
258
-
259
-
260
-
261
-
262
-
263
-
264
 |
 |

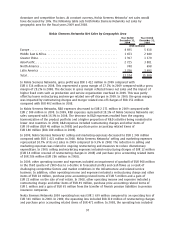
States. In Greater China, Nokia continued to benefit from its brand, broad product portfolio and
extensive distribution system during 2009.
Nokia’s device ASP in 2009 was EUR 63, a decline of 15% from EUR 74 in 2008. Industry ASPs also
declined in 2009. Nokia’s lower ASP in 2009 compared to 2008 was primarily the result of a higher
proportion of lowerpriced entry level device sales as well as general price pressure.
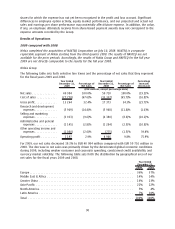
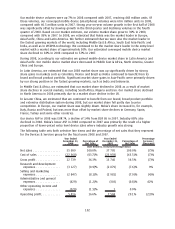
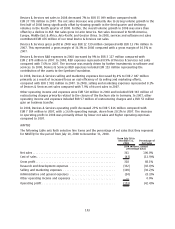
The following table sets forth selective line items and the percentage of net sales that they represent
for the Devices & Services group for the fiscal years 2009 and 2008.
Year Ended
December 31,
2009
Percentage of
Net Sales
Year Ended
December 31,
2008
Percentage of
Net Sales
Percentage
Increase/
(Decrease)
(EUR millions, except percentage data)
Net sales ................. 27853 100.0% 35099 100.0% (21)%
Cost of sales .............. (18583) (66.7)% (22 360) (63.7)% (17)%
Gross profit ............... 9270 33.3% 12 739 36.3% (27)%
Research and development
expenses ............... (2984) (10.7)% (3 127) (8.9)% (5)%
Selling and marketing
expenses ............... (2366) (8.5)% (2 847) (8.1)% (17)%
Administrative and general
expenses ............... (417) (1.5)% (429) (1.2)% (3)%
Other operating income and
expenses ............... (189) (0.7)% (520) (1.5)% (64)%
Operating profit............ 3314 11.9% 5 816 16.6% (43)%
Devices & Services net sales in 2009 decreased 21% to EUR 27 853 million compared with
EUR 35 099 million in 2008. The decline was driven by both volume decline as well as ASP decline. Of
our total Devices & Services net sales, services contributed EUR 607 million in 2009. Net sales in
Devices & Services were down in all regions except Greater China year on year.
Devices & Services gross profit in 2009 was EUR 9 270 million compared with EUR 12 739 million in
2008, a decline of 27%. This represented a gross margin of 33.3% in 2009 compared with a gross
margin of 36.3% in 2008.
Devices & Services R&D expenses in 2009 decreased 5% to EUR 2 984 million compared with
EUR 3 127 million in 2008. In 2009, R&D expenses represented 10.7% of Devices & Services net sales
compared with 8.9% in 2008. The decrease Devices & Services R&D expenses in 2009 was due to the
measures taken to adjust our business operations and cost base to prevailing market conditions. In
2009, Devices & Services R&D expenses included EUR 8 million amortization of acquired intangible
assets. In 2008, Devices & Services R&D expenses included EUR 153 million representing the
contribution of the assets to the Symbian Foundation.
In 2009, Devices & Services selling and marketing expenses decreased 17% to EUR 2 366 million
compared with EUR 2 847 million in 2008. The decrease was due to the measures taken to adjust our
business operations and cost base to prevailing market conditions. In 2009, selling and marketing
expenses represented 8.5% of Devices & Services net sales compared with 8.1% of its net sales in
2008.
Other operating income and expenses were EUR 189 million in 2009 and included restructuring
charges of EUR 178 million, impairment of assets EUR 56 million and gain on the sale of the security
appliance business of EUR 68 million. In 2008 other operating income and expenses of
EUR 520 million included EUR 392 million of restructuring charges primarily related to the closure of
the Bochum site in Germany.
94