Nokia 2009 Annual Report Download - page 236
Download and view the complete annual report
Please find page 236 of the 2009 Nokia annual report below. You can navigate through the pages in the report by either clicking on the pages listed below, or by using the keyword search tool below to find specific information within the annual report.-
 1
1 -
2
-
3
-
4
-
5
-
6
-
7
-
8
-
9
-
10
-
11
-
12
-
13
-
14
-
15
-
16
-
17
-
18
-
19
-
20
-
21
-
22
-
23
-
24
-
25
-
26
-
27
-
28
-
29
-
30
-
31
-
32
-
33
-
34
-
35
-
36
-
37
-
38
-
39
-
40
-
41
-
42
-
43
-
44
-
45
-
46
-
47
-
48
-
49
-
50
-
51
-
52
-
53
-
54
-
55
-
56
-
57
-
58
-
59
-
60
-
61
-
62
-
63
-
64
-
65
-
66
-
67
-
68
-
69
-
70
-
71
-
72
-
73
-
74
-
75
-
76
-
77
-
78
-
79
-
80
-
81
-
82
-
83
-
84
-
85
-
86
-
87
-
88
-
89
-
90
-
91
-
92
-
93
-
94
-
95
-
96
-
97
-
98
-
99
-
100
-
101
-
102
-
103
-
104
-
105
-
106
-
107
-
108
-
109
-
110
-
111
-
112
-
113
-
114
-
115
-
116
-
117
-
118
-
119
-
120
-
121
-
122
-
123
-
124
-
125
-
126
-
127
-
128
-
129
-
130
-
131
-
132
-
133
-
134
-
135
-
136
-
137
-
138
-
139
-
140
-
141
-
142
-
143
-
144
-
145
-
146
-
147
-
148
-
149
-
150
-
151
-
152
-
153
-
154
-
155
-
156
-
157
-
158
-
159
-
160
-
161
-
162
-
163
-
164
-
165
-
166
-
167
-
168
-
169
-
170
-
171
-
172
-
173
-
174
-
175
-
176
-
177
-
178
-
179
-
180
-
181
-
182
-
183
-
184
-
185
-
186
-
187
-
188
-
189
-
190
-
191
-
192
-
193
-
194
-
195
-
196
-
197
-
198
-
199
-
200
-
201
-
202
-
203
-
204
-
205
-
206
-
207
-
208
-
209
-
210
-
211
-
212
-
213
-
214
-
215
-
216
-
217
-
218
-
219
-
220
-
221
-
222
-
223
-
224
-
225
-
 226
226 -
 227
227 -
 228
228 -
 229
229 -
 230
230 -
 231
231 -
 232
232 -
 233
233 -
 234
234 -
 235
235 -
 236
236 -
 237
237 -
 238
238 -
 239
239 -
 240
240 -
 241
241 -
 242
242 -
 243
243 -
 244
244 -
 245
245 -
 246
246 -
247
-
248
-
249
-
250
-
251
-
252
-
253
-
254
-
255
-
256
-
257
-
258
-
259
-
260
-
261
-
262
-
263
-
264
 |
 |

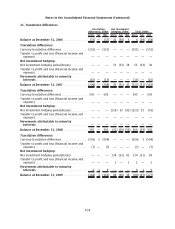
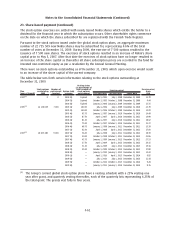
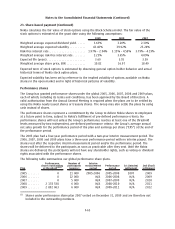
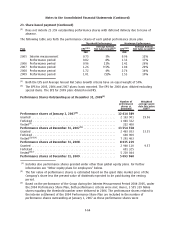
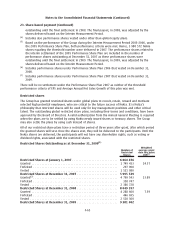
23. Sharebased payment (Continued)
Total stock options outstanding as at December 31, 2009
(1)
Number of shares
Weighted average
exercise price
EUR
(2)
Weighted
average share
price EUR
(2)
Shares under option at January 1, 2007....... 93 285 229 16.28
Granted................................... 3211965 18.48
Exercised ................................. 57776205 16.99 21.75
Forfeited .................................. 1992666 15.13
Expired ................................... 1161096 17.83
Shares under option at December 31, 2007.... 35 567 227 15.28
Granted................................... 3767163 17.44
Exercised ................................. 3657985 14.21 22.15
Forfeited .................................. 783557 16.31
Expired ................................... 11078983 14.96
Shares under option at December 31, 2008.... 23 813 865 15.89
Granted................................... 4791232 11.15
Exercised ................................. 104172 6.18 9.52
Forfeited .................................. 893943 17.01
Expired ................................... 4567020 13.55
Shares under option at December 31, 2009.... 23 039 962 15.39
Options exercisable at December 31, 2006
(shares) ................................. 69721916 16.65
Options exercisable at December 31, 2007
(shares) ................................. 21535000 14.66
Options exercisable at December 31, 2008
(shares) ................................. 12895057 14.77
Options exercisable at December 31, 2009
(shares) ................................. 13 124 925 16.09
(1)
Includes also stock options granted under other than global equity plans. For further information
see “Other equity plans for employees” below.
(2)
The weighted average exercise price and the weighted average share price do not incorporate the
effect of transferable stock option exercises during 2007 by option holders not employed by the
Group.
The weighted average grant date fair value of stock options granted was EUR 2.34 in 2009, EUR 3.92
in 2008, and EUR 3.24 in 2007.
The options outstanding by range of exercise price at December 31, 2009 are as follows:
Exercise prices EUR Number of shares
Weighted average
remaining
contractual life
in years
Weighted
average
exercise
price EUR
Options outstanding
0.81 9.93................................... 215987 4.27 6.07
10.2614.99 .................................. 10498214 3.06 12.10
15.3719.86 .................................. 12202542 2.61 18.28
21.8637.37 .................................. 123219 2.03 26.63
23 039 962
F62
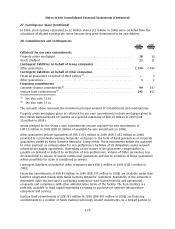
Notes to the Consolidated Financial Statements (Continued)