Nokia 2009 Annual Report Download - page 92
Download and view the complete annual report
Please find page 92 of the 2009 Nokia annual report below. You can navigate through the pages in the report by either clicking on the pages listed below, or by using the keyword search tool below to find specific information within the annual report.-
 1
1 -
2
-
3
-
4
-
5
-
6
-
7
-
8
-
9
-
10
-
11
-
12
-
13
-
14
-
15
-
16
-
17
-
18
-
19
-
20
-
21
-
22
-
23
-
24
-
25
-
26
-
27
-
28
-
29
-
30
-
31
-
32
-
33
-
34
-
35
-
36
-
37
-
38
-
39
-
40
-
41
-
42
-
43
-
44
-
45
-
46
-
47
-
48
-
49
-
50
-
51
-
52
-
53
-
54
-
55
-
56
-
57
-
58
-
59
-
60
-
61
-
62
-
63
-
64
-
65
-
66
-
67
-
68
-
69
-
70
-
71
-
72
-
73
-
74
-
75
-
76
-
77
-
78
-
79
-
80
-
81
-
 82
82 -
 83
83 -
 84
84 -
 85
85 -
 86
86 -
 87
87 -
 88
88 -
 89
89 -
 90
90 -
 91
91 -
 92
92 -
 93
93 -
 94
94 -
 95
95 -
 96
96 -
 97
97 -
 98
98 -
 99
99 -
 100
100 -
 101
101 -
 102
102 -
103
-
104
-
105
-
106
-
107
-
108
-
109
-
110
-
111
-
112
-
113
-
114
-
115
-
116
-
117
-
118
-
119
-
120
-
121
-
122
-
123
-
124
-
125
-
126
-
127
-
128
-
129
-
130
-
131
-
132
-
133
-
134
-
135
-
136
-
137
-
138
-
139
-
140
-
141
-
142
-
143
-
144
-
145
-
146
-
147
-
148
-
149
-
150
-
151
-
152
-
153
-
154
-
155
-
156
-
157
-
158
-
159
-
160
-
161
-
162
-
163
-
164
-
165
-
166
-
167
-
168
-
169
-
170
-
171
-
172
-
173
-
174
-
175
-
176
-
177
-
178
-
179
-
180
-
181
-
182
-
183
-
184
-
185
-
186
-
187
-
188
-
189
-
190
-
191
-
192
-
193
-
194
-
195
-
196
-
197
-
198
-
199
-
200
-
201
-
202
-
203
-
204
-
205
-
206
-
207
-
208
-
209
-
210
-
211
-
212
-
213
-
214
-
215
-
216
-
217
-
218
-
219
-
220
-
221
-
222
-
223
-
224
-
225
-
226
-
227
-
228
-
229
-
230
-
231
-
232
-
233
-
234
-
235
-
236
-
237
-
238
-
239
-
240
-
241
-
242
-
243
-
244
-
245
-
246
-
247
-
248
-
249
-
250
-
251
-
252
-
253
-
254
-
255
-
256
-
257
-
258
-
259
-
260
-
261
-
262
-
263
-
264
 |
 |

shares for which the expense has not yet been recognized in the profit and loss account. Significant
differences in employee option activity, equity market performance, and our projected and actual net
sales and earnings per share performance may materially affect future expense. In addition, the value,
if any, an employee ultimately receives from sharebased payment awards may not correspond to the
expense amounts recorded by the Group.
Results of Operations
2009 compared with 2008
Nokia completed the acquisition of NAVTEQ Corporation on July 10, 2008. NAVTEQ is a separate
reportable segment of Nokia starting from the third quarter 2008. The results of NAVTEQ are not
available for the prior periods. Accordingly, the results of Nokia Group and NAVTEQ for the full year
2009 are not directly comparable to the results for the full year 2008.
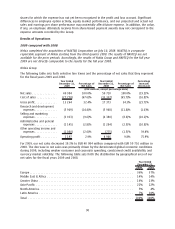
Nokia Group
The following table sets forth selective line items and the percentage of net sales that they represent
for the fiscal years 2009 and 2008.
Year Ended
December 31,
2009
Percentage of
Net Sales
Year Ended
December 31,
2008
Percentage of
Net Sales
Percentage
Increase/
(Decrease)
(EUR millions, except percentage data)
Net sales . . .............. 40984 100.0% 50 710 100.0% (19.2)%
Cost of sales ............. (27720) (67.6)% (33 337) (65.7)% (16.8)%
Gross profit .............. 13264 32.4% 17 373 34.3% (23.7)%
Research and development
expenses .............. (5909) (14.4)% (5 968) (11.8)% (1.0)%
Selling and marketing
expenses .............. (3933) (9.6)% (4 380) (8.6)% (10.2)%
Administrative and general
expenses .............. (1145) (2.8)% (1 284) (2.5)% (10.8)%
Other operating income and
expenses .............. (1080) (2.6)% (775) (1.5)% 39.4%
Operating profit . ......... 1197 2.9% 4 966 9.8% 75.9%
For 2009, our net sales decreased 19.2% to EUR 40 984 million compared with EUR 50 710 million in
2008. The decrease in net sales was primarily driven by the deteriorated global economic conditions
during 2009, including weaker consumer and corporate spending, constrained credit availability and
currency market volatility. The following table sets forth the distribution by geographical area of our
net sales for the fiscal years 2009 and 2008.
2009 2008
Year Ended
December 31,
Europe................................................................ 36% 37%
Middle East & Africa ..................................................... 14% 14%
Greater China .......................................................... 16% 13%
AsiaPacific ............................................................ 22% 22%
North America.......................................................... 5% 4%
Latin America .......................................................... 7% 10%
Total ................................................................. 100% 100%
90