Nokia 2009 Annual Report Download - page 10
Download and view the complete annual report
Please find page 10 of the 2009 Nokia annual report below. You can navigate through the pages in the report by either clicking on the pages listed below, or by using the keyword search tool below to find specific information within the annual report.-
 1
1 -
 2
2 -
 3
3 -
 4
4 -
 5
5 -
 6
6 -
 7
7 -
 8
8 -
 9
9 -
 10
10 -
 11
11 -
 12
12 -
 13
13 -
 14
14 -
 15
15 -
 16
16 -
 17
17 -
 18
18 -
 19
19 -
 20
20 -
 21
21 -
22
-
23
-
24
-
25
-
26
-
27
-
28
-
29
-
30
-
31
-
32
-
33
-
34
-
35
-
36
-
37
-
38
-
39
-
40
-
41
-
42
-
43
-
44
-
45
-
46
-
47
-
48
-
49
-
50
-
51
-
52
-
53
-
54
-
55
-
56
-
57
-
58
-
59
-
60
-
61
-
62
-
63
-
64
-
65
-
66
-
67
-
68
-
69
-
70
-
71
-
72
-
73
-
74
-
75
-
76
-
77
-
78
-
79
-
80
-
81
-
82
-
83
-
84
-
85
-
86
-
87
-
88
-
89
-
90
-
91
-
92
-
93
-
94
-
95
-
96
-
97
-
98
-
99
-
100
-
101
-
102
-
103
-
104
-
105
-
106
-
107
-
108
-
109
-
110
-
111
-
112
-
113
-
114
-
115
-
116
-
117
-
118
-
119
-
120
-
121
-
122
-
123
-
124
-
125
-
126
-
127
-
128
-
129
-
130
-
131
-
132
-
133
-
134
-
135
-
136
-
137
-
138
-
139
-
140
-
141
-
142
-
143
-
144
-
145
-
146
-
147
-
148
-
149
-
150
-
151
-
152
-
153
-
154
-
155
-
156
-
157
-
158
-
159
-
160
-
161
-
162
-
163
-
164
-
165
-
166
-
167
-
168
-
169
-
170
-
171
-
172
-
173
-
174
-
175
-
176
-
177
-
178
-
179
-
180
-
181
-
182
-
183
-
184
-
185
-
186
-
187
-
188
-
189
-
190
-
191
-
192
-
193
-
194
-
195
-
196
-
197
-
198
-
199
-
200
-
201
-
202
-
203
-
204
-
205
-
206
-
207
-
208
-
209
-
210
-
211
-
212
-
213
-
214
-
215
-
216
-
217
-
218
-
219
-
220
-
221
-
222
-
223
-
224
-
225
-
226
-
227
-
228
-
229
-
230
-
231
-
232
-
233
-
234
-
235
-
236
-
237
-
238
-
239
-
240
-
241
-
242
-
243
-
244
-
245
-
246
-
247
-
248
-
249
-
250
-
251
-
252
-
253
-
254
-
255
-
256
-
257
-
258
-
259
-
260
-
261
-
262
-
263
-
264
 |
 |

2005
(1)
2006
(1)
2007
(1)
2008
(1)
2009
(1)
2009
(1)
Year Ended December 31,
(EUR) (EUR) (EUR) (EUR) (EUR) (USD)
(in millions, except per share data)
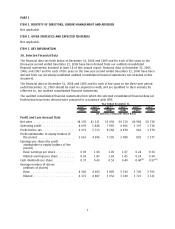
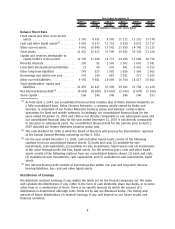
Balance Sheet Data
Fixed assets and other noncurrent
assets. . ......................... 3501 4031 8305 15112 12125 17378
Cash and other liquid assets
(3)
......... 9910 8537 11753 6820 8873 12717
Other current assets ................. 9041 10049 17541 17650 14740 21125
Total assets ........................ 22452 22617 37599 39582 35738 51220
Capital and reserves attributable to
equity holders of the parent ......... 12309 11968 14773 14208 13088 18758
Minority interests ................... 205 92 2565 2302 1661 2381
Longterm interestbearing liabilities.... 21 69 203 861 4432 6352
Other longterm liabilities ............ 247 327 1082 1856 1369 1962
Borrowings due within one year ....... 279 180 887 3591 771 1105
Other current liabilities ............... 9391 9981 18089 16764 14417 20662
Total shareholders’ equity and
liabilities ........................ 22452 22617 37599 39582 35738 51220
Net interestbearing debt
(4)
........... (9610) (8 288) (10 663) (2 368) (3 670) (5 260)
Share capital ....................... 266 246 246 246 246 353
(1)
As from April 1, 2007, our consolidated financial data includes that of Nokia Siemens Networks on
a fully consolidated basis. Nokia Siemens Networks, a company jointly owned by Nokia and
Siemens, is comprised of our former Networks business group and Siemens’ carrierrelated
operations for fixed and mobile networks. Accordingly, our consolidated financial data for the
years ended December 31, 2005 and 2006 is not directly comparable to any subsequent years and
our consolidated financial data for the year ended December 31, 2007 is not directly comparable
to any prior or subsequent years. Our consolidated financial data for the periods prior to April 1,
2007 included our former Networks business group only.
(2)
The cash dividend for 2009 is what the Board of Directors will propose for shareholders’ approval
at the Annual General Meeting convening on May 6, 2010.
(3)
For the year ended December 31, 2009, cash and other liquid assets consist of the following
captions from our consolidated balance sheets: (1) bank and cash, (2) availableforsale
investments, cash equivalents, (3) availableforsale investments, liquid assets and (4) investments
at fair value through profit and loss, liquid assets. For the previous years, cash and other liquid
assets consist of the following captions from our consolidated balance sheets: (1) bank and cash,
(2) availableforsale investments, cash equivalents, and (3) availableforsale investments, liquid
assets.
(4)
Net interestbearing debt consists of borrowings due within one year and longterm interest
bearing liabilities, less cash and other liquid assets.
Distribution of Earnings
We distribute retained earnings, if any, within the limits set by the Finnish Companies Act. We make
and calculate the distribution, if any, either in the form of cash dividends, share buybacks, or in some
other form or a combination of these. There is no specific formula by which the amount of a
distribution is determined, although some limits set by law are discussed below. The timing and
amount of future distributions of retained earnings, if any, will depend on our future results and
financial condition.
8