Nokia 2009 Annual Report Download - page 205
Download and view the complete annual report
Please find page 205 of the 2009 Nokia annual report below. You can navigate through the pages in the report by either clicking on the pages listed below, or by using the keyword search tool below to find specific information within the annual report.-
 1
1 -
2
-
3
-
4
-
5
-
6
-
7
-
8
-
9
-
10
-
11
-
12
-
13
-
14
-
15
-
16
-
17
-
18
-
19
-
20
-
21
-
22
-
23
-
24
-
25
-
26
-
27
-
28
-
29
-
30
-
31
-
32
-
33
-
34
-
35
-
36
-
37
-
38
-
39
-
40
-
41
-
42
-
43
-
44
-
45
-
46
-
47
-
48
-
49
-
50
-
51
-
52
-
53
-
54
-
55
-
56
-
57
-
58
-
59
-
60
-
61
-
62
-
63
-
64
-
65
-
66
-
67
-
68
-
69
-
70
-
71
-
72
-
73
-
74
-
75
-
76
-
77
-
78
-
79
-
80
-
81
-
82
-
83
-
84
-
85
-
86
-
87
-
88
-
89
-
90
-
91
-
92
-
93
-
94
-
95
-
96
-
97
-
98
-
99
-
100
-
101
-
102
-
103
-
104
-
105
-
106
-
107
-
108
-
109
-
110
-
111
-
112
-
113
-
114
-
115
-
116
-
117
-
118
-
119
-
120
-
121
-
122
-
123
-
124
-
125
-
126
-
127
-
128
-
129
-
130
-
131
-
132
-
133
-
134
-
135
-
136
-
137
-
138
-
139
-
140
-
141
-
142
-
143
-
144
-
145
-
146
-
147
-
148
-
149
-
150
-
151
-
152
-
153
-
154
-
155
-
156
-
157
-
158
-
159
-
160
-
161
-
162
-
163
-
164
-
165
-
166
-
167
-
168
-
169
-
170
-
171
-
172
-
173
-
174
-
175
-
176
-
177
-
178
-
179
-
180
-
181
-
182
-
183
-
184
-
185
-
186
-
187
-
188
-
189
-
190
-
191
-
192
-
193
-
194
-
 195
195 -
 196
196 -
 197
197 -
 198
198 -
 199
199 -
 200
200 -
 201
201 -
 202
202 -
 203
203 -
 204
204 -
 205
205 -
 206
206 -
 207
207 -
 208
208 -
 209
209 -
 210
210 -
 211
211 -
 212
212 -
 213
213 -
 214
214 -
 215
215 -
216
-
217
-
218
-
219
-
220
-
221
-
222
-
223
-
224
-
225
-
226
-
227
-
228
-
229
-
230
-
231
-
232
-
233
-
234
-
235
-
236
-
237
-
238
-
239
-
240
-
241
-
242
-
243
-
244
-
245
-
246
-
247
-
248
-
249
-
250
-
251
-
252
-
253
-
254
-
255
-
256
-
257
-
258
-
259
-
260
-
261
-
262
-
263
-
264
 |
 |

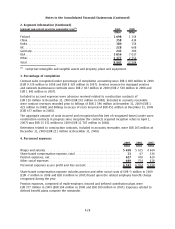
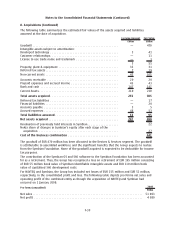
5. Pensions (Continued)
The amounts recognized in the income statement are as follows:
2009 2008 2007
EURm EURm EURm
Current service cost ................................................. 55 79 125
Interest cost ....................................................... 69 78 104
Expected return on plan assets ........................................ (70) (71) (95)
Net actuarial (gains) losses recognized in year ........................... (9) —10
Impact of paragraph 58(b) limitation ................................... 5——
Past service cost (gain) loss........................................... —2—
Curtailment ....................................................... —(12) (1)
Settlement ........................................................ —152 (12)
Total, included in personnel expenses .................................. 50 228 131
Movements in prepaid (accrued) pension costs recognized in the statement of financial position are as
follows:
2009 2008
EURm EURm
Prepaid (accrued) pension costs at beginning of year ............................ (120) (36)
Net income (expense) recognized in the profit and loss account.................... (50) (228)
Contributions paid ........................................................ 49 141
Benefits paid . ........................................................... 16 12
Acquisitions . . ........................................................... 13
Foreign exchange......................................................... (2) (12)
Prepaid (accrued) pension costs at end of year* ................................ (106) (120)
* included within prepaid expenses and accrued income / accrued expenses
The prepaid pension cost above is made up of a prepayment of EUR 68 million (EUR 55 million in
2008) and an accrual of EUR 174 million (EUR 175 million in 2008).
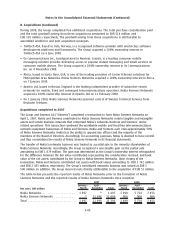
2009 2008 2007 2006 2005
EURm EURm EURm EURm EURm
Present value of defined benefit obligation ........... (1 411) (1 205) (2 266) (1 577) (1 385)
Plan assets at fair value ........................... 1 330 1 197 2 174 1 409 1 276
Surplus/(Deficit) ................................. (81) (8) (92) (168) (109)
Experience adjustments arising on plan obligations amount to a loss of EUR 12 million in 2009 (gain
of EUR 50 million in 2008, a loss of EUR 31 million in 2007 and EUR 25 million in 2006). Experience
adjustments arising on plan assets amount to a gain of EUR 54 million in 2009 (a loss of
EUR 22 million in 2008, EUR 3 million in 2007 and EUR 11 million in 2006).
The principal actuarial weighted average assumptions used were as follows:
2009 2008
%%
Discount rate for determining present values .................................... 5.3 5.8
Expected longterm rate of return on plan assets ................................ 5.4 5.7
Annual rate of increase in future compensation levels ............................. 2.8 2.7
Pension increases ......................................................... 2.0 1.9
F31
Notes to the Consolidated Financial Statements (Continued)