Nokia 2009 Annual Report Download - page 104
Download and view the complete annual report
Please find page 104 of the 2009 Nokia annual report below. You can navigate through the pages in the report by either clicking on the pages listed below, or by using the keyword search tool below to find specific information within the annual report.-
 1
1 -
2
-
3
-
4
-
5
-
6
-
7
-
8
-
9
-
10
-
11
-
12
-
13
-
14
-
15
-
16
-
17
-
18
-
19
-
20
-
21
-
22
-
23
-
24
-
25
-
26
-
27
-
28
-
29
-
30
-
31
-
32
-
33
-
34
-
35
-
36
-
37
-
38
-
39
-
40
-
41
-
42
-
43
-
44
-
45
-
46
-
47
-
48
-
49
-
50
-
51
-
52
-
53
-
54
-
55
-
56
-
57
-
58
-
59
-
60
-
61
-
62
-
63
-
64
-
65
-
66
-
67
-
68
-
69
-
70
-
71
-
72
-
73
-
74
-
75
-
76
-
77
-
78
-
79
-
80
-
81
-
82
-
83
-
84
-
85
-
86
-
87
-
88
-
89
-
90
-
91
-
92
-
93
-
 94
94 -
 95
95 -
 96
96 -
 97
97 -
 98
98 -
 99
99 -
 100
100 -
 101
101 -
 102
102 -
 103
103 -
 104
104 -
 105
105 -
 106
106 -
 107
107 -
 108
108 -
 109
109 -
 110
110 -
 111
111 -
 112
112 -
 113
113 -
 114
114 -
115
-
116
-
117
-
118
-
119
-
120
-
121
-
122
-
123
-
124
-
125
-
126
-
127
-
128
-
129
-
130
-
131
-
132
-
133
-
134
-
135
-
136
-
137
-
138
-
139
-
140
-
141
-
142
-
143
-
144
-
145
-
146
-
147
-
148
-
149
-
150
-
151
-
152
-
153
-
154
-
155
-
156
-
157
-
158
-
159
-
160
-
161
-
162
-
163
-
164
-
165
-
166
-
167
-
168
-
169
-
170
-
171
-
172
-
173
-
174
-
175
-
176
-
177
-
178
-
179
-
180
-
181
-
182
-
183
-
184
-
185
-
186
-
187
-
188
-
189
-
190
-
191
-
192
-
193
-
194
-
195
-
196
-
197
-
198
-
199
-
200
-
201
-
202
-
203
-
204
-
205
-
206
-
207
-
208
-
209
-
210
-
211
-
212
-
213
-
214
-
215
-
216
-
217
-
218
-
219
-
220
-
221
-
222
-
223
-
224
-
225
-
226
-
227
-
228
-
229
-
230
-
231
-
232
-
233
-
234
-
235
-
236
-
237
-
238
-
239
-
240
-
241
-
242
-
243
-
244
-
245
-
246
-
247
-
248
-
249
-
250
-
251
-
252
-
253
-
254
-
255
-
256
-
257
-
258
-
259
-
260
-
261
-
262
-
263
-
264
 |
 |

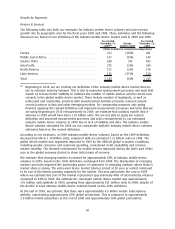
Our mobile device volumes were up 7% in 2008 compared with 2007, reaching 468 million units. Of
those volumes, our converged mobile device (smartphone) volumes were 60.6 million units in 2008,
compared with 60.5 million units in 2007. Strong yearonyear volume growth in the first half of 2008
was significantly offset by slowing growth in the third quarter and declining volumes in the fourth
quarter of 2008. Based on our market estimate, our volume market share grew to 39% in 2008,
compared with 38% in 2007. In 2008, we estimated that Nokia was the market leader in Europe,
AsiaPacific, China and Latin America. We further estimated that we were also the market leader in
the fastest growing markets of the world, including Middle East & Africa, South East AsiaPacific and
India, as well as in WCDMA technology. We continued to be the market share leader in the entrylevel
market with a market share of approximately 50%. Our estimated converged mobile device market
share declined to 38% in 2008 compared to 52% in 2007.
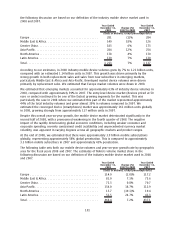
During 2008, according to our estimates we gained mobile device market share in Latin America and
AsiaPacific. Our mobile device market share decreased in Middle East & Africa, North America, Greater
China and Europe.
In Latin America, we estimated that our 2008 market share was up significantly driven by strong
share gains in markets such as Colombia, Mexico and Brazil as Nokia continued to benefit from its
brand and broad product portfolio. Significant market share gains in AsiaPacific were primarily driven
by our strong position in the fastest growing markets, such as India and Indonesia.
In Middle East & Africa, we estimated that our market share declined in 2008 as a result of market
share declines in several markets, including South Africa, Nigeria and Iran. Our market share declined
in North America in 2008 primarily due to a market share decline in the US.
In Greater China, we estimated that we continued to benefit from our brand, broad product portfolio
and extensive distribution system during 2008, but our market share fell partly due to price
competition. In Europe, our market share was slightly down. Nokia’s share increased in, for example,
Italy, Russia and Poland, but was more than offset by market share declines in Germany, Spain,
France, Turkey and some other countries.
Our device ASP in 2008 was EUR 74, a decline of 14% from EUR 86 in 2007. Industry ASPs also
declined in 2008. Nokia’s lower ASP in 2008 compared to 2007 was primarily the result of a higher
proportion of lowerpriced entry level device sales where industry growth was strong.
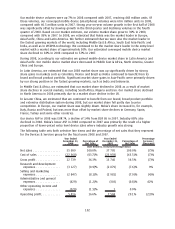
The following table sets forth selective line items and the percentage of net sales that they represent
for the Devices & Services group for the fiscal years 2008 and 2007.
Year Ended
December 31,
2008
Percentage of
Net Sales
Year Ended
December 31,
2007
Percentage of
Net Sales
Percentage
Increase/
(Decrease)
(EUR millions, except percentage data)
Net sales ................. 35099 100.0% 37 705 100.0% (7)%
Cost of sales .............. (22360) (63.7)% (23 959) (63.5)% (7)%
Gross profit ............... 12739 36.3% 13 746 36.5% (7)%
Research and development
expenses ............... (3127) (8.9)% (2 879) (7.6)% 9%
Selling and marketing
expenses ............... (2847) (8.1)% (2 981) (7.9)% (4)%
Administrative and general
expenses ............... (429) (1.2)% (303) (0.8)% 42%
Other operating income and
expenses ............... (520) (1.5)% 1 0.0%
Operating profit............ 5816 16.6% 7 584 20.1% (23)%
102