Nokia 2009 Annual Report Download - page 260
Download and view the complete annual report
Please find page 260 of the 2009 Nokia annual report below. You can navigate through the pages in the report by either clicking on the pages listed below, or by using the keyword search tool below to find specific information within the annual report.-
 1
1 -
2
-
3
-
4
-
5
-
6
-
7
-
8
-
9
-
10
-
11
-
12
-
13
-
14
-
15
-
16
-
17
-
18
-
19
-
20
-
21
-
22
-
23
-
24
-
25
-
26
-
27
-
28
-
29
-
30
-
31
-
32
-
33
-
34
-
35
-
36
-
37
-
38
-
39
-
40
-
41
-
42
-
43
-
44
-
45
-
46
-
47
-
48
-
49
-
50
-
51
-
52
-
53
-
54
-
55
-
56
-
57
-
58
-
59
-
60
-
61
-
62
-
63
-
64
-
65
-
66
-
67
-
68
-
69
-
70
-
71
-
72
-
73
-
74
-
75
-
76
-
77
-
78
-
79
-
80
-
81
-
82
-
83
-
84
-
85
-
86
-
87
-
88
-
89
-
90
-
91
-
92
-
93
-
94
-
95
-
96
-
97
-
98
-
99
-
100
-
101
-
102
-
103
-
104
-
105
-
106
-
107
-
108
-
109
-
110
-
111
-
112
-
113
-
114
-
115
-
116
-
117
-
118
-
119
-
120
-
121
-
122
-
123
-
124
-
125
-
126
-
127
-
128
-
129
-
130
-
131
-
132
-
133
-
134
-
135
-
136
-
137
-
138
-
139
-
140
-
141
-
142
-
143
-
144
-
145
-
146
-
147
-
148
-
149
-
150
-
151
-
152
-
153
-
154
-
155
-
156
-
157
-
158
-
159
-
160
-
161
-
162
-
163
-
164
-
165
-
166
-
167
-
168
-
169
-
170
-
171
-
172
-
173
-
174
-
175
-
176
-
177
-
178
-
179
-
180
-
181
-
182
-
183
-
184
-
185
-
186
-
187
-
188
-
189
-
190
-
191
-
192
-
193
-
194
-
195
-
196
-
197
-
198
-
199
-
200
-
201
-
202
-
203
-
204
-
205
-
206
-
207
-
208
-
209
-
210
-
211
-
212
-
213
-
214
-
215
-
216
-
217
-
218
-
219
-
220
-
221
-
222
-
223
-
224
-
225
-
226
-
227
-
228
-
229
-
230
-
231
-
232
-
233
-
234
-
235
-
236
-
237
-
238
-
239
-
240
-
241
-
242
-
243
-
244
-
245
-
246
-
247
-
248
-
249
-
 250
250 -
 251
251 -
 252
252 -
 253
253 -
 254
254 -
 255
255 -
 256
256 -
 257
257 -
 258
258 -
 259
259 -
 260
260 -
 261
261 -
 262
262 -
 263
263 -
 264
264
 |
 |

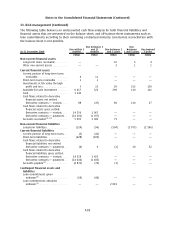
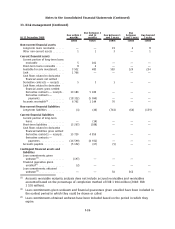
33. Risk management (Continued)
At 31 December 2008
Due within 3
months
Due between 3
and 12
months
Due between 1
and 3 years
Due
between
3 and 5 years
Due beyond
5 years
EURm EURm EURm EURm EURm
Noncurrent financial assets
Longterm loans receivable . . . . . . — — 19 6 8
Other noncurrent assets . . . . . . . . 1 1 3 — 1
Current financial assets
Current portion of longterm loans
receivable . . . . . . . . . . . . . . . . . 5 101 — — —
Shortterm loans receivable . . . . . . 8 2 — — —
Availableforsale investment . . . . . 3 932 483 583 120 254
Cash . . . . . . . . . . . . . . . . . . . . . . . 1 706 — — — —
Cash flows related to derivative
financial assets net settled :
Derivative contracts — receipts . . . 5 3 1 — —
Cash flows related to derivative
financial assets gross settled:
Derivative contracts — receipts. . 19 180 5 184 — — —
Derivative contracts —
payments . . . . . . . . . . . . . . . . (18 322) (5 090) — — —
Accounts receivable
(1)
.......... 6702 1144 70 — —
Noncurrent financial liabilities
Longterm liabilities . . . . . . . . . . . (1) (46) (741) (64) (159)
Current financial liabilities
Current portion of longterm
loans . . . . . . . . . . . . . . . . . . . . . — (14) — — —
Shortterm liabilities . . . . . . . . . . . (3 207) (388) — — —
Cash flows related to derivative
financial liabilities gross settled:
Derivative contracts — receipts. . 15 729 4 859 — — —
Derivative contracts —
payments . . . . . . . . . . . . . . . . (16 599) (4 931) — — —
Accounts payable. . . . . . . . . . . . . . (5 152) (67) (5) — —
Contingent financial assets and
liabilities
Loan commitments given
undrawn
(2)
. . . . . . . . . . . . . . . . . (197) — — —
Financial guarantee given
uncalled
(2)
................. (2) — — — —
Loan commitments obtained
undrawn
(3)
................. — — 50 362 —
(1)
Accounts receivable maturity analysis does not include accrued receivables and receivables
accounted based on the percentage of completion method of EUR 1 004 million (2008: EUR
1 528 million).
(2)
Loan commitments given undrawn and financial guarantees given uncalled have been included in
the earliest period in which they could be drawn or called.
(3)
Loan commitments obtained undrawn have been included based on the period in which they
expire.
F86
Notes to the Consolidated Financial Statements (Continued)