Nokia 2009 Annual Report Download - page 235
Download and view the complete annual report
Please find page 235 of the 2009 Nokia annual report below. You can navigate through the pages in the report by either clicking on the pages listed below, or by using the keyword search tool below to find specific information within the annual report.-
 1
1 -
2
-
3
-
4
-
5
-
6
-
7
-
8
-
9
-
10
-
11
-
12
-
13
-
14
-
15
-
16
-
17
-
18
-
19
-
20
-
21
-
22
-
23
-
24
-
25
-
26
-
27
-
28
-
29
-
30
-
31
-
32
-
33
-
34
-
35
-
36
-
37
-
38
-
39
-
40
-
41
-
42
-
43
-
44
-
45
-
46
-
47
-
48
-
49
-
50
-
51
-
52
-
53
-
54
-
55
-
56
-
57
-
58
-
59
-
60
-
61
-
62
-
63
-
64
-
65
-
66
-
67
-
68
-
69
-
70
-
71
-
72
-
73
-
74
-
75
-
76
-
77
-
78
-
79
-
80
-
81
-
82
-
83
-
84
-
85
-
86
-
87
-
88
-
89
-
90
-
91
-
92
-
93
-
94
-
95
-
96
-
97
-
98
-
99
-
100
-
101
-
102
-
103
-
104
-
105
-
106
-
107
-
108
-
109
-
110
-
111
-
112
-
113
-
114
-
115
-
116
-
117
-
118
-
119
-
120
-
121
-
122
-
123
-
124
-
125
-
126
-
127
-
128
-
129
-
130
-
131
-
132
-
133
-
134
-
135
-
136
-
137
-
138
-
139
-
140
-
141
-
142
-
143
-
144
-
145
-
146
-
147
-
148
-
149
-
150
-
151
-
152
-
153
-
154
-
155
-
156
-
157
-
158
-
159
-
160
-
161
-
162
-
163
-
164
-
165
-
166
-
167
-
168
-
169
-
170
-
171
-
172
-
173
-
174
-
175
-
176
-
177
-
178
-
179
-
180
-
181
-
182
-
183
-
184
-
185
-
186
-
187
-
188
-
189
-
190
-
191
-
192
-
193
-
194
-
195
-
196
-
197
-
198
-
199
-
200
-
201
-
202
-
203
-
204
-
205
-
206
-
207
-
208
-
209
-
210
-
211
-
212
-
213
-
214
-
215
-
216
-
217
-
218
-
219
-
220
-
221
-
222
-
223
-
224
-
 225
225 -
 226
226 -
 227
227 -
 228
228 -
 229
229 -
 230
230 -
 231
231 -
 232
232 -
 233
233 -
 234
234 -
 235
235 -
 236
236 -
 237
237 -
 238
238 -
 239
239 -
 240
240 -
 241
241 -
 242
242 -
 243
243 -
 244
244 -
 245
245 -
246
-
247
-
248
-
249
-
250
-
251
-
252
-
253
-
254
-
255
-
256
-
257
-
258
-
259
-
260
-
261
-
262
-
263
-
264
 |
 |

23. Sharebased payment (Continued)
The stock option exercises are settled with newly issued Nokia shares which entitle the holder to a
dividend for the financial year in which the subscription occurs. Other shareholder rights commence
on the date on which the shares subscribed for are registered with the Finnish Trade Register.
Pursuant to the stock options issued under the global stock option plans, an aggregate maximum
number of 22 755 509 new Nokia shares may be subscribed for, representing 0.6% of the total
number of votes at December 31, 2009. During 2009, the exercise of 7 500 options resulted in the
issuance of 7 500 new shares. The exercises of stock options resulted in an increase of Nokia’s share
capital prior to May 3, 2007. After that date the exercises of stock options have no longer resulted in
an increase of the share capital as thereafter all share subscription prices are recorded in the fund for
invested nonrestricted equity as per a resolution by the Annual General Meeting.
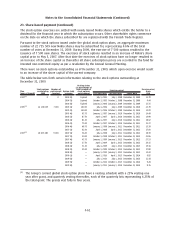
There were no stock options outstanding as of December 31, 2009, which upon exercise would result
in an increase of the share capital of the parent company.
The table below sets forth certain information relating to the stock options outstanding at
December 31, 2009.
Plan
(year of launch)
Stock options
outstanding
2009
Number of
participants
(approx.)
Option (sub)
category
Vesting status
(as percentage of
total number of
stock options
outstanding) First vest date Last vest date Expiry date
Exercise price/
share
EUR
Exercise period
2003
(1)
0 0 2004 2Q Expired July 1, 2005 July 1, 2008 December 31, 2009 11.79
2004 3Q Expired October 3, 2005 October 1, 2008 December 31, 2009 9.44
2004 4Q Expired January 2, 2006 January 2, 2009 December 31, 2009 12.35
2005
(1)
12 120 029 7 000 2005 2Q 100.00 July 1, 2006 July 1, 2009 December 31, 2010 12.79
2005 3Q 100.00 October 1, 2006 October 1, 2009 December 31, 2010 13.09
2005 4Q 93.75 January 1, 2007 January 1, 2010 December 31, 2010 14.48
2006 1Q 87.50 April 1, 2007 April 1, 2010 December 31, 2011 14.99
2006 2Q 81.25 July 1, 2007 July 1, 2010 December 31, 2011 18.02
2006 3Q 75.00 October 1, 2007 October 1, 2010 December 31, 2011 15.37
2006 4Q 68.75 January 1, 2008 January 1, 2011 December 31, 2011 15.38
2007 1Q 62.50 April 1, 2008 April 1, 2011 December 31, 2011 17.00
2007
(1)
10 635 480 9 000 2007 2Q 56.25 July 1, 2008 July 1, 2011 December 31, 2012 18.39
2007 3Q 50.00 October 1, 2008 October 1, 2011 December 31, 2012 21.86
2007 4Q 43.75 January 1, 2009 January 1, 2012 December 31, 2012 27.53
2008 1Q 37.50 April 1, 2009 April 1, 2012 December 31, 2013 24.15
2008 2Q 31.25 July 1, 2009 July 1, 2012 December 31, 2013 19.16
2008 3Q 25.00 October 1, 2009 October 1, 2012 December 31, 2013 17.80
2008 4Q — January 1, 2010 January 1, 2013 December 31, 2013 12.43
2009 1Q — April 1, 2010 April 1, 2013 December 31, 2014 9.82
2009 2Q — July 1, 2010 July 1, 2013 December 31, 2014 11.18
2009 3Q — October 1, 2010 October 1, 2013 December 31, 2014 9.28
2009 4Q — January 1, 2011 January 1, 2014 December 31, 2014 8.76
(1)
The Group’s current global stock option plans have a vesting schedule with a 25% vesting one
year after grant, and quarterly vesting thereafter, each of the quarterly lots representing 6.25% of
the total grant. The grants vest fully in four years.
F61
Notes to the Consolidated Financial Statements (Continued)