Nokia 2003 Annual Report Download - page 9
Download and view the complete annual report
Please find page 9 of the 2003 Nokia annual report below. You can navigate through the pages in the report by either clicking on the pages listed below, or by using the keyword search tool below to find specific information within the annual report.-
 1
1 -
 2
2 -
 3
3 -
 4
4 -
 5
5 -
 6
6 -
 7
7 -
 8
8 -
 9
9 -
 10
10 -
 11
11 -
 12
12 -
 13
13 -
 14
14 -
 15
15 -
 16
16 -
 17
17 -
 18
18 -
 19
19 -
 20
20 -
 21
21 -
 22
22 -
 23
23 -
 24
24 -
 25
25 -
 26
26 -
 27
27 -
 28
28 -
 29
29 -
 30
30 -
 31
31 -
 32
32 -
 33
33 -
 34
34 -
 35
35 -
 36
36 -
 37
37 -
 38
38 -
 39
39 -
 40
40 -
 41
41 -
 42
42 -
 43
43 -
 44
44 -
 45
45 -
 46
46 -
 47
47 -
 48
48 -
 49
49 -
 50
50 -
 51
51 -
 52
52 -
 53
53 -
 54
54 -
 55
55 -
 56
56 -
 57
57 -
 58
58 -
 59
59 -
 60
60 -
 61
61 -
 62
62 -
 63
63 -
 64
64 -
 65
65 -
 66
66 -
 67
67 -
 68
68 -
 69
69 -
 70
70 -
 71
71 -
 72
72 -
 73
73 -
 74
74 -
 75
75 -
 76
76 -
 77
77 -
 78
78 -
 79
79 -
 80
80 -
 81
81 -
 82
82 -
 83
83 -
 84
84 -
 85
85 -
 86
86 -
 87
87 -
 88
88 -
 89
89 -
 90
90 -
 91
91 -
 92
92 -
 93
93 -
 94
94 -
 95
95 -
 96
96 -
 97
97 -
 98
98 -
 99
99 -
 100
100 -
 101
101 -
 102
102 -
 103
103 -
 104
104 -
 105
105 -
 106
106 -
 107
107 -
 108
108 -
 109
109 -
 110
110 -
 111
111 -
 112
112 -
 113
113 -
 114
114 -
 115
115 -
 116
116 -
 117
117 -
 118
118 -
 119
119 -
 120
120 -
 121
121 -
 122
122 -
 123
123 -
 124
124 -
 125
125 -
 126
126 -
 127
127 -
 128
128 -
 129
129 -
 130
130 -
 131
131 -
 132
132 -
 133
133 -
 134
134 -
 135
135 -
 136
136 -
 137
137 -
 138
138 -
 139
139 -
 140
140 -
 141
141 -
 142
142 -
 143
143 -
 144
144 -
 145
145 -
 146
146 -
 147
147 -
 148
148 -
 149
149 -
 150
150 -
 151
151 -
 152
152 -
 153
153 -
 154
154 -
 155
155 -
 156
156 -
 157
157 -
 158
158 -
 159
159 -
 160
160 -
 161
161 -
 162
162 -
 163
163 -
 164
164 -
 165
165 -
 166
166 -
 167
167 -
 168
168 -
 169
169 -
 170
170 -
 171
171 -
 172
172 -
 173
173 -
 174
174
 |
 |

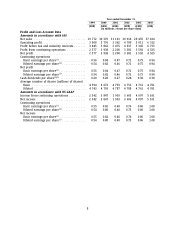
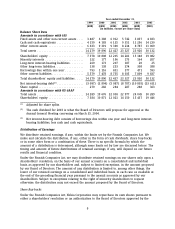
Year ended December 31,
1999 2000 2001 2002 2003 2003
(EUR) (EUR) (EUR) (EUR) (EUR) (USD)
(in millions, except per share data)
Profit and Loss Account Data
Amounts in accordance with IAS
Net sales ............................... 19 772 30 376 31 191 30 016 29 455 37 104
Operating profit .......................... 3 908 5 776 3 362 4 780 5 011 6 312
Profit before tax and minority interests ....... 3 845 5 862 3 475 4 917 5 345 6 733
Profit from continuing operations ........... 2 577 3 938 2 200 3 381 3 592 4 525
Net profit ............................... 2 577 3 938 2 200 3 381 3 592 4 525
Continuing operations
Basic earnings per share(1) ................ 0.56 0.84 0.47 0.71 0.75 0.94
Diluted earnings per share(1) .............. 0.54 0.82 0.46 0.71 0.75 0.94
Net profit
Basic earnings per share(1) ................ 0.56 0.84 0.47 0.71 0.75 0.94
Diluted earnings per share(1) .............. 0.54 0.82 0.46 0.71 0.75 0.94
Cash dividends per share(1)(2) ............... 0.20 0.28 0.27 0.28 0.30 0.38
Average number of shares (millions of shares)
Basic ................................. 4 594 4 673 4 703 4 751 4 761 4 761
Diluted ............................... 4 743 4 793 4 787 4 788 4 761 4 761
Amounts in accordance with US GAAP
Income from continuing operations .......... 2 542 3 847 1 903 3 603 4 097 5 161
Net income ............................. 2 542 3 847 1 903 3 603 4 097 5 161
Continuing operations
Basic earnings per share(1) ................ 0.55 0.82 0.40 0.76 0.86 1.08
Diluted earnings per share(1) .............. 0.54 0.80 0.40 0.75 0.86 1.08
Net income
Basic earnings per share(1) ................ 0.55 0.82 0.40 0.76 0.86 1.08
Diluted earnings per share(1) .............. 0.54 0.80 0.40 0.75 0.86 1.08
8
