Nokia 2003 Annual Report Download - page 53
Download and view the complete annual report
Please find page 53 of the 2003 Nokia annual report below. You can navigate through the pages in the report by either clicking on the pages listed below, or by using the keyword search tool below to find specific information within the annual report.-
 1
1 -
2
-
3
-
4
-
5
-
6
-
7
-
8
-
9
-
10
-
11
-
12
-
13
-
14
-
15
-
16
-
17
-
18
-
19
-
20
-
21
-
22
-
23
-
24
-
25
-
26
-
27
-
28
-
29
-
30
-
31
-
32
-
33
-
34
-
35
-
36
-
37
-
38
-
39
-
40
-
41
-
42
-
 43
43 -
 44
44 -
 45
45 -
 46
46 -
 47
47 -
 48
48 -
 49
49 -
 50
50 -
 51
51 -
 52
52 -
 53
53 -
 54
54 -
 55
55 -
 56
56 -
 57
57 -
 58
58 -
 59
59 -
 60
60 -
 61
61 -
 62
62 -
 63
63 -
64
-
65
-
66
-
67
-
68
-
69
-
70
-
71
-
72
-
73
-
74
-
75
-
76
-
77
-
78
-
79
-
80
-
81
-
82
-
83
-
84
-
85
-
86
-
87
-
88
-
89
-
90
-
91
-
92
-
93
-
94
-
95
-
96
-
97
-
98
-
99
-
100
-
101
-
102
-
103
-
104
-
105
-
106
-
107
-
108
-
109
-
110
-
111
-
112
-
113
-
114
-
115
-
116
-
117
-
118
-
119
-
120
-
121
-
122
-
123
-
124
-
125
-
126
-
127
-
128
-
129
-
130
-
131
-
132
-
133
-
134
-
135
-
136
-
137
-
138
-
139
-
140
-
141
-
142
-
143
-
144
-
145
-
146
-
147
-
148
-
149
-
150
-
151
-
152
-
153
-
154
-
155
-
156
-
157
-
158
-
159
-
160
-
161
-
162
-
163
-
164
-
165
-
166
-
167
-
168
-
169
-
170
-
171
-
172
-
173
-
174
 |
 |
our investments in building the Nokia brand and our marketing activities, see ‘‘Item 4.B Business
Overview—Sales and Marketing.’’
At the end of 2003, we employed 51 359 people world-wide, compared to 51 748 and 53 849 at
December 31, 2002 and 2001, respectively. In 2003, our personnel decreased by a net total of 389
employees as a result of restructuring at Nokia Networks, offset by recruitment mainly in research
and development at Nokia Mobile Phones. In 2002, we decreased our personnel by 2 101, mainly
as a result of outsourcing and restructuring at Nokia Networks and Nokia Ventures Organization.
2003 compared to 2002
Nokia Net Sales and Operating Profit
In 2003, economic conditions started to improve in the US and elsewhere in the Americas, and in
the latter part of the year the Asia-Pacific market also began to show signs of recovery. In the
main European markets, weak economic conditions continued. The US dollar continued to
depreciate against the euro, falling by 17% in 2003 (year-end rate compared to year-end rate for
the previous year). This currency development had a material negative impact on our net sales
expressed in euros because approximately 50% of our net sales are generated in US dollars and
currencies closely following the US dollar. For more information, see ‘‘—Exchange Rates’’ below.
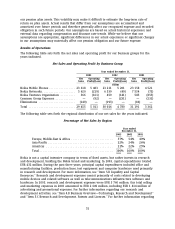
Our net sales totaled EUR 29 455 million in 2003 and EUR 30 016 million in 2002, representing a
decrease of 2% in 2003. At constant currency, net sales would have grown 7% year on year. Our
gross margin in 2003 improved to 41.5% compared to 39.1% in 2002, with the improvement
coming primarily from Nokia Mobile Phones and to a lesser extent from Nokia Networks. In 2003,
the clear improvement in the quality of our mobile phones resulted in a lower quality cost per
phone than in 2002. Also the product mix consisted of slightly more lower-end phones with lower
product costs, and contributed to a lower average cost per phone. Depreciation of the US dollar
and also the Japanese yen also contributed to a lower average cost per phone because more than
50% of our mobile phone components are sourced in US dollars and approximately 25% in
Japanese yen. All these factors together decreased cost of sales in Nokia Mobile Phones. In Nokia
Networks, quality in our network deliveries improved towards the end of the year impacting
positively on the gross margin. Also the product mix as well as the depreciation of sourcing
currencies contributed to higher margins than in 2002.
Our operating profit increased by 5% to EUR 5 011 million in 2003, compared to EUR 4 780 million
in 2002, as a result of the increase in our gross margins, as described in the previous paragraph.
Our operating margin was 17.0% in 2003, compared to 15.9% in 2002. We continued to invest
significantly in research and development. R&D expenses totaled EUR 3 760 million in 2003, an
increase of 23% from 2002 (EUR 3 052 million). If personnel related restructuring costs
(EUR 15 million) as well as impairments and write-offs of capitalized R&D costs (EUR 455 million)
in Nokia Networks totaling EUR 470 million were excluded, the increase in R&D expenses would
have been 8%. R&D expenses represented 12.8% of net sales in 2003, compared to 10.2% of net
sales in 2002. Excluding the restructuring costs, impairments and write-offs in Nokia Networks,
R&D expenses would have represented 11.2% of net sales in 2003.
In 2003, Nokia’s operating profit included the following exceptional items, each within Nokia
Networks: a positive adjustment of EUR 226 million as a result of the customer finance
impairment recorded in 2002 related to MobilCom, the above mentioned R&D related costs totaling
EUR 470 million, other restructuring costs of EUR 80 million, as well as a goodwill impairment of
EUR 151 million. The goodwill impairment charge related to Nokia Networks’ Core Networks
business. The positive adjustment related to MobilCom is discussed below under ‘‘—Segment
Results—Nokia Networks’’ and ‘‘Item 5.B Liquidity and Capital Resources—Customer Financing.’’
52