Nokia 2003 Annual Report Download - page 133
Download and view the complete annual report
Please find page 133 of the 2003 Nokia annual report below. You can navigate through the pages in the report by either clicking on the pages listed below, or by using the keyword search tool below to find specific information within the annual report.-
 1
1 -
2
-
3
-
4
-
5
-
6
-
7
-
8
-
9
-
10
-
11
-
12
-
13
-
14
-
15
-
16
-
17
-
18
-
19
-
20
-
21
-
22
-
23
-
24
-
25
-
26
-
27
-
28
-
29
-
30
-
31
-
32
-
33
-
34
-
35
-
36
-
37
-
38
-
39
-
40
-
41
-
42
-
43
-
44
-
45
-
46
-
47
-
48
-
49
-
50
-
51
-
52
-
53
-
54
-
55
-
56
-
57
-
58
-
59
-
60
-
61
-
62
-
63
-
64
-
65
-
66
-
67
-
68
-
69
-
70
-
71
-
72
-
73
-
74
-
75
-
76
-
77
-
78
-
79
-
80
-
81
-
82
-
83
-
84
-
85
-
86
-
87
-
88
-
89
-
90
-
91
-
92
-
93
-
94
-
95
-
96
-
97
-
98
-
99
-
100
-
101
-
102
-
103
-
104
-
105
-
106
-
107
-
108
-
109
-
110
-
111
-
112
-
113
-
114
-
115
-
116
-
117
-
118
-
119
-
120
-
121
-
122
-
 123
123 -
 124
124 -
 125
125 -
 126
126 -
 127
127 -
 128
128 -
 129
129 -
 130
130 -
 131
131 -
 132
132 -
 133
133 -
 134
134 -
 135
135 -
 136
136 -
 137
137 -
 138
138 -
 139
139 -
 140
140 -
 141
141 -
 142
142 -
 143
143 -
144
-
145
-
146
-
147
-
148
-
149
-
150
-
151
-
152
-
153
-
154
-
155
-
156
-
157
-
158
-
159
-
160
-
161
-
162
-
163
-
164
-
165
-
166
-
167
-
168
-
169
-
170
-
171
-
172
-
173
-
174
 |
 |

Notes to the Consolidated Financial Statements (Continued)
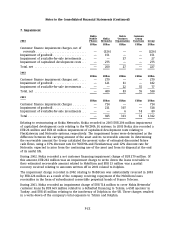
8. Acquisitions (Continued)
In January 2001 Nokia acquired in a cash tender offer Ramp Networks, a provider of purpose built
Internet security appliances, for EUR 147 million. The fair value of net assets acquired was
EUR (16) million giving rise to goodwill of EUR 163 million.
9. Depreciation and amortization
2003 2002 2001
EURm EURm EURm
Depreciation and amortization by asset category
Intangible assets
Capitalized development costs ................................... 327 233 169
Intangible rights .............................................. 51 65 65
Goodwill .................................................... 159 206 302
Other intangible assets ......................................... 21 28 34
Property, plant and equipment
Buildings and constructions ..................................... 34 37 31
Machinery and equipment ...................................... 545 737 811
Other tangible assets .......................................... 1518
Total ......................................................... 1,138 1,311 1,430
Depreciation and amortization by function
Cost of sales ................................................... 214 314 367
R&D.......................................................... 537 473 427
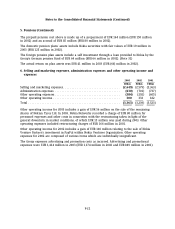
Selling, marketing and administration .............................. 185 211 264
Other operating expenses ......................................... 43 107 70
Goodwill ...................................................... 159 206 302
Total ......................................................... 1,138 1,311 1,430
10. Financial income and expenses
2003 2002 2001
EURm EURm EURm
Income from available-for-sale investments
Dividend income .............................................. 24 25 27
Interest income ............................................... 323 230 215
Other financial income ........................................... 38 27 24
Exchange gains and losses ........................................ 32 (29) (25)
Interest expense ................................................ (25) (43) (82)
Other financial expenses ......................................... (40) (54) (34)
Total ......................................................... 352 156 125
F-24