Nokia 2003 Annual Report Download - page 125
Download and view the complete annual report
Please find page 125 of the 2003 Nokia annual report below. You can navigate through the pages in the report by either clicking on the pages listed below, or by using the keyword search tool below to find specific information within the annual report.-
 1
1 -
2
-
3
-
4
-
5
-
6
-
7
-
8
-
9
-
10
-
11
-
12
-
13
-
14
-
15
-
16
-
17
-
18
-
19
-
20
-
21
-
22
-
23
-
24
-
25
-
26
-
27
-
28
-
29
-
30
-
31
-
32
-
33
-
34
-
35
-
36
-
37
-
38
-
39
-
40
-
41
-
42
-
43
-
44
-
45
-
46
-
47
-
48
-
49
-
50
-
51
-
52
-
53
-
54
-
55
-
56
-
57
-
58
-
59
-
60
-
61
-
62
-
63
-
64
-
65
-
66
-
67
-
68
-
69
-
70
-
71
-
72
-
73
-
74
-
75
-
76
-
77
-
78
-
79
-
80
-
81
-
82
-
83
-
84
-
85
-
86
-
87
-
88
-
89
-
90
-
91
-
92
-
93
-
94
-
95
-
96
-
97
-
98
-
99
-
100
-
101
-
102
-
103
-
104
-
105
-
106
-
107
-
108
-
109
-
110
-
111
-
112
-
113
-
114
-
 115
115 -
 116
116 -
 117
117 -
 118
118 -
 119
119 -
 120
120 -
 121
121 -
 122
122 -
 123
123 -
 124
124 -
 125
125 -
 126
126 -
 127
127 -
 128
128 -
 129
129 -
 130
130 -
 131
131 -
 132
132 -
 133
133 -
 134
134 -
 135
135 -
136
-
137
-
138
-
139
-
140
-
141
-
142
-
143
-
144
-
145
-
146
-
147
-
148
-
149
-
150
-
151
-
152
-
153
-
154
-
155
-
156
-
157
-
158
-
159
-
160
-
161
-
162
-
163
-
164
-
165
-
166
-
167
-
168
-
169
-
170
-
171
-
172
-
173
-
174
 |
 |

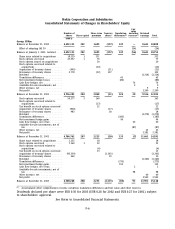
Notes to the Consolidated Financial Statements (Continued)
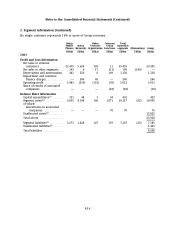
2. Segment information (Continued)
No single customer represents 10% or more of Group revenues.
Nokia Nokia Common Total
Mobile Nokia Ventures Group reportable
Phones Networks Organization Functions segments Eliminations Group
EURm EURm EURm EURm EURm EURm EURm
2003
Profit and Loss Information
Net sales to external
customers ............... 23,475 5,620 349 11 29,455 29,455
Net sales to other segments . . . 143 0 17 (11) 149 (149) —
Depreciation and amortization . 441 520 8 169 1,138 1,138
Impairment and customer
finance charges ........... — 200 40 — 240 240
Operating profit ............ 5,483 (219) (161) (92) 5,011 5,011
Share of results of associated
companies ............... — — — (18) (18) (18)
Balance Sheet Information
Capital expenditures(1) ....... 331 44 3 54 432 432
Segment assets(2) ............ 4,832 4,108 106 1,071 10,117 (22) 10,095
of which:
Investments in associated
companies ............. — — — 76 76 76
Unallocated assets(3) ......... 13,825
Total assets ................ 23,920
Segment liabilities(4) ......... 5,273 1,628 147 159 7,207 (22) 7,185
Unallocated liabilities(5) ....... 1,423
Total liabilities ............. 8,608
F-16