Nokia 2003 Annual Report Download - page 126
Download and view the complete annual report
Please find page 126 of the 2003 Nokia annual report below. You can navigate through the pages in the report by either clicking on the pages listed below, or by using the keyword search tool below to find specific information within the annual report.-
 1
1 -
2
-
3
-
4
-
5
-
6
-
7
-
8
-
9
-
10
-
11
-
12
-
13
-
14
-
15
-
16
-
17
-
18
-
19
-
20
-
21
-
22
-
23
-
24
-
25
-
26
-
27
-
28
-
29
-
30
-
31
-
32
-
33
-
34
-
35
-
36
-
37
-
38
-
39
-
40
-
41
-
42
-
43
-
44
-
45
-
46
-
47
-
48
-
49
-
50
-
51
-
52
-
53
-
54
-
55
-
56
-
57
-
58
-
59
-
60
-
61
-
62
-
63
-
64
-
65
-
66
-
67
-
68
-
69
-
70
-
71
-
72
-
73
-
74
-
75
-
76
-
77
-
78
-
79
-
80
-
81
-
82
-
83
-
84
-
85
-
86
-
87
-
88
-
89
-
90
-
91
-
92
-
93
-
94
-
95
-
96
-
97
-
98
-
99
-
100
-
101
-
102
-
103
-
104
-
105
-
106
-
107
-
108
-
109
-
110
-
111
-
112
-
113
-
114
-
115
-
 116
116 -
 117
117 -
 118
118 -
 119
119 -
 120
120 -
 121
121 -
 122
122 -
 123
123 -
 124
124 -
 125
125 -
 126
126 -
 127
127 -
 128
128 -
 129
129 -
 130
130 -
 131
131 -
 132
132 -
 133
133 -
 134
134 -
 135
135 -
 136
136 -
137
-
138
-
139
-
140
-
141
-
142
-
143
-
144
-
145
-
146
-
147
-
148
-
149
-
150
-
151
-
152
-
153
-
154
-
155
-
156
-
157
-
158
-
159
-
160
-
161
-
162
-
163
-
164
-
165
-
166
-
167
-
168
-
169
-
170
-
171
-
172
-
173
-
174
 |
 |

Notes to the Consolidated Financial Statements (Continued)
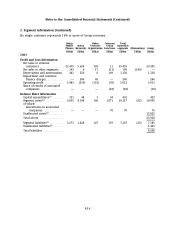
2. Segment information (Continued)
Nokia Nokia Common Total
Mobile Nokia Ventures Group reportable
Phones Networks Organization Functions segments Eliminations Group
EURm EURm EURm EURm EURm EURm EURm
2002
Profit and Loss Information
Net sales to external
customers ............... 22,997 6,538 441 40 30,016 30,016
Net sales to other segments . . . 214 1 18 (40) 193 (193) —
Depreciation and amortization . 546 542 33 190 1,311 1,311
Impairment and customer
finance charges ........... — 400 83 55 538 538
Operating profit ............ 5,201 (49) (141) (231) 4,780 4,780
Share of results of associated
companies ............... — — — (19) (19) (19)
Balance Sheet Information
Capital expenditures(1) ....... 224 93 8 107 432 432
Segment assets(2) ............ 4,888 6,163 114 965 12,130 (26) 12,104
of which:
Investments in associated
companies ............. — — — 49 49 49
Unallocated assets(3) ......... 11,223
Total assets ................ 23,327
Segment liabilities(4) ......... 5,080 1,861 188 225 7,354 (24) 7,330
Unallocated liabilities(5) ....... 1,543
Total liabilities ............. 8,873
2001
Profit and Loss Information
Net sales to external customers 23,107 7,521 563 — 31,191 31,191
Net sales to other segments . . . 51 13 22 — 86 (86) —
Depreciation and amortization . 642 511 115 162 1,430 1,430
Impairment and customer
finance charges ........... — 925 307 80 1,312 1,312
Operating profit ............ 4,521 (73) (855) (231) 3,362 3,362
Share of results of associated
companies ............... — — — (12) (12) (12)
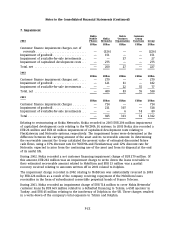
(1) Including goodwill and capitalized development costs, capital expenditures amount to
EUR 670 million in 2003 (EUR 860 million in 2002). The goodwill and capitalized development costs
consist of EUR 36 million in 2003 (EUR 41 million in 2002) for Nokia Mobile Phones, EUR 182 million
in 2003 (EUR 377 million in 2002) for Nokia Networks, EUR 20 million in 2003 (EUR 1 million in
2002) for Nokia Ventures Organization and EUR 0 million in 2003 (EUR 9 million in 2002) for
Common Group Functions.
(2) Comprises intangible assets, property, plant and equipment, investments, inventories and accounts
receivable as well as prepaid expenses and accrued income except those related to interest and
taxes.
F-17