Nokia 2003 Annual Report Download - page 114
Download and view the complete annual report
Please find page 114 of the 2003 Nokia annual report below. You can navigate through the pages in the report by either clicking on the pages listed below, or by using the keyword search tool below to find specific information within the annual report.-
 1
1 -
2
-
3
-
4
-
5
-
6
-
7
-
8
-
9
-
10
-
11
-
12
-
13
-
14
-
15
-
16
-
17
-
18
-
19
-
20
-
21
-
22
-
23
-
24
-
25
-
26
-
27
-
28
-
29
-
30
-
31
-
32
-
33
-
34
-
35
-
36
-
37
-
38
-
39
-
40
-
41
-
42
-
43
-
44
-
45
-
46
-
47
-
48
-
49
-
50
-
51
-
52
-
53
-
54
-
55
-
56
-
57
-
58
-
59
-
60
-
61
-
62
-
63
-
64
-
65
-
66
-
67
-
68
-
69
-
70
-
71
-
72
-
73
-
74
-
75
-
76
-
77
-
78
-
79
-
80
-
81
-
82
-
83
-
84
-
85
-
86
-
87
-
88
-
89
-
90
-
91
-
92
-
93
-
94
-
95
-
96
-
97
-
98
-
99
-
100
-
101
-
102
-
103
-
 104
104 -
 105
105 -
 106
106 -
 107
107 -
 108
108 -
 109
109 -
 110
110 -
 111
111 -
 112
112 -
 113
113 -
 114
114 -
 115
115 -
 116
116 -
 117
117 -
 118
118 -
 119
119 -
 120
120 -
 121
121 -
 122
122 -
 123
123 -
 124
124 -
125
-
126
-
127
-
128
-
129
-
130
-
131
-
132
-
133
-
134
-
135
-
136
-
137
-
138
-
139
-
140
-
141
-
142
-
143
-
144
-
145
-
146
-
147
-
148
-
149
-
150
-
151
-
152
-
153
-
154
-
155
-
156
-
157
-
158
-
159
-
160
-
161
-
162
-
163
-
164
-
165
-
166
-
167
-
168
-
169
-
170
-
171
-
172
-
173
-
174
 |
 |

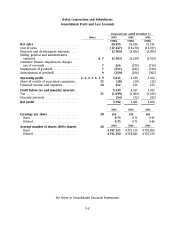
Nokia Corporation and Subsidiaries
Consolidated Cash Flow Statements (Continued)
Financial year ended
December 31
Notes 2003 2002 2001
EURm EURm EURm
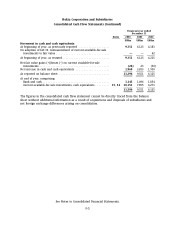
Movement in cash and cash equivalents:
At beginning of year, as previously reported ................... 9,351 6,125 4,183
On adoption of IAS 39, remeasurement of current available-for-sale
investments to fair value ................................. ——42
At beginning of year, as restated ............................. 9,351 6,125 4,225
Net fair value gains (+)/losses (–) on current available-for-sale
investments ........................................... (24) 23 (30)
Net increase in cash and cash equivalents ..................... 1,969 3,203 1,930
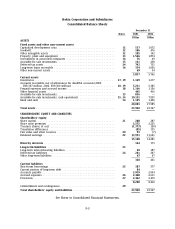
As reported on balance sheet ............................... 11,296 9,351 6,125
At end of year, comprising:
Bank and cash ......................................... 1,145 1,496 1,854
Current available-for-sale investments, cash equivalents ......... 15, 34 10,151 7,855 4,271
11,296 9,351 6,125
The figures in the consolidated cash flow statement cannot be directly traced from the balance
sheet without additional information as a result of acquisitions and disposals of subsidiaries and
net foreign exchange differences arising on consolidation.
See Notes to Consolidated Financial Statements.
F-5