Nokia 2003 Annual Report Download - page 111
Download and view the complete annual report
Please find page 111 of the 2003 Nokia annual report below. You can navigate through the pages in the report by either clicking on the pages listed below, or by using the keyword search tool below to find specific information within the annual report.-
 1
1 -
2
-
3
-
4
-
5
-
6
-
7
-
8
-
9
-
10
-
11
-
12
-
13
-
14
-
15
-
16
-
17
-
18
-
19
-
20
-
21
-
22
-
23
-
24
-
25
-
26
-
27
-
28
-
29
-
30
-
31
-
32
-
33
-
34
-
35
-
36
-
37
-
38
-
39
-
40
-
41
-
42
-
43
-
44
-
45
-
46
-
47
-
48
-
49
-
50
-
51
-
52
-
53
-
54
-
55
-
56
-
57
-
58
-
59
-
60
-
61
-
62
-
63
-
64
-
65
-
66
-
67
-
68
-
69
-
70
-
71
-
72
-
73
-
74
-
75
-
76
-
77
-
78
-
79
-
80
-
81
-
82
-
83
-
84
-
85
-
86
-
87
-
88
-
89
-
90
-
91
-
92
-
93
-
94
-
95
-
96
-
97
-
98
-
99
-
100
-
 101
101 -
 102
102 -
 103
103 -
 104
104 -
 105
105 -
 106
106 -
 107
107 -
 108
108 -
 109
109 -
 110
110 -
 111
111 -
 112
112 -
 113
113 -
 114
114 -
 115
115 -
 116
116 -
 117
117 -
 118
118 -
 119
119 -
 120
120 -
 121
121 -
122
-
123
-
124
-
125
-
126
-
127
-
128
-
129
-
130
-
131
-
132
-
133
-
134
-
135
-
136
-
137
-
138
-
139
-
140
-
141
-
142
-
143
-
144
-
145
-
146
-
147
-
148
-
149
-
150
-
151
-
152
-
153
-
154
-
155
-
156
-
157
-
158
-
159
-
160
-
161
-
162
-
163
-
164
-
165
-
166
-
167
-
168
-
169
-
170
-
171
-
172
-
173
-
174
 |
 |

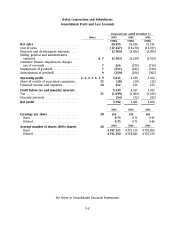
Nokia Corporation and Subsidiaries
Consolidated Profit and Loss Accounts
Financial year ended December 31
Notes 2003 2002 2001
EURm EURm EURm
Net sales .......................... 29,455 30,016 31,191
Cost of sales ........................ (17,237) (18,278) (19,787)
Research and development expenses ..... (3,760) (3,052) (2,985)
Selling, general and administrative
expenses ......................... 6, 7 (3,363) (3,239) (3,523)
Customer finance impairment charges,
net of reversals .................... 7 226 (279) (714)
Impairment of goodwill ............... 7 (151) (182) (518)
Amortization of goodwill .............. 9 (159) (206) (302)
Operating profit .................... 2, 3, 4, 5, 6, 7, 9 5,011 4,780 3,362
Share of results of associated companies . . 32 (18) (19) (12)
Financial income and expenses ......... 10 352 156 125
Profit before tax and minority interests .. 5,345 4,917 3,475
Tax ............................... 11 (1,699) (1,484) (1,192)
Minority interests .................... (54) (52) (83)
Net profit .......................... 3,592 3,381 2,200
2003 2002 2001
Earnings per share .................. 28 EUR EUR EUR
Basic ............................ 0.75 0.71 0.47
Diluted ........................... 0.75 0.71 0.46
2003 2002 2001
Average number of shares (000’s shares) .28
Basic ............................ 4,761,121 4,751,110 4,702,852
Diluted ........................... 4,761,160 4,788,042 4,787,219
See Notes to Consolidated Financial Statements.
F-2