Nokia 2003 Annual Report Download - page 166
Download and view the complete annual report
Please find page 166 of the 2003 Nokia annual report below. You can navigate through the pages in the report by either clicking on the pages listed below, or by using the keyword search tool below to find specific information within the annual report.-
 1
1 -
2
-
3
-
4
-
5
-
6
-
7
-
8
-
9
-
10
-
11
-
12
-
13
-
14
-
15
-
16
-
17
-
18
-
19
-
20
-
21
-
22
-
23
-
24
-
25
-
26
-
27
-
28
-
29
-
30
-
31
-
32
-
33
-
34
-
35
-
36
-
37
-
38
-
39
-
40
-
41
-
42
-
43
-
44
-
45
-
46
-
47
-
48
-
49
-
50
-
51
-
52
-
53
-
54
-
55
-
56
-
57
-
58
-
59
-
60
-
61
-
62
-
63
-
64
-
65
-
66
-
67
-
68
-
69
-
70
-
71
-
72
-
73
-
74
-
75
-
76
-
77
-
78
-
79
-
80
-
81
-
82
-
83
-
84
-
85
-
86
-
87
-
88
-
89
-
90
-
91
-
92
-
93
-
94
-
95
-
96
-
97
-
98
-
99
-
100
-
101
-
102
-
103
-
104
-
105
-
106
-
107
-
108
-
109
-
110
-
111
-
112
-
113
-
114
-
115
-
116
-
117
-
118
-
119
-
120
-
121
-
122
-
123
-
124
-
125
-
126
-
127
-
128
-
129
-
130
-
131
-
132
-
133
-
134
-
135
-
136
-
137
-
138
-
139
-
140
-
141
-
142
-
143
-
144
-
145
-
146
-
147
-
148
-
149
-
150
-
151
-
152
-
153
-
154
-
155
-
 156
156 -
 157
157 -
 158
158 -
 159
159 -
 160
160 -
 161
161 -
 162
162 -
 163
163 -
 164
164 -
 165
165 -
 166
166 -
 167
167 -
 168
168 -
 169
169 -
 170
170 -
 171
171 -
 172
172 -
 173
173 -
 174
174
 |
 |

Notes to the Consolidated Financial Statements (Continued)
36. Differences between International Accounting Standards and U.S. Generally Accepted
Accounting Principles (Continued)
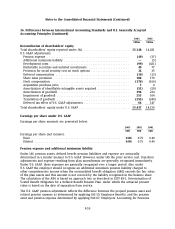
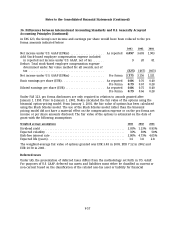
in FAS 123, the Group’s net income and earnings per share would have been reduced to the pro
forma amounts indicated below:
2003 2002 2001
Net income under U.S. GAAP (EURm) .................... As reported 4,097 3,603 1,903
Add: Stock-based employee compensation expense included
in reported net income under U.S. GAAP, net of tax ....... 320 81
Deduct: Total stock-based employee compensation expense
determined under fair value method for all awards, net of
tax ............................................. (325) (467) (663)
Net income under U.S. GAAP (EURm) .................... Pro forma 3,775 3,156 1,321
Basic earnings per share (EUR) ......................... As reported 0.86 0.76 0.40
Pro forma 0.79 0.67 0.28
Diluted earnings per share (EUR) ....................... As reported 0.86 0.75 0.40
Pro forma 0.79 0.66 0.28
Under FAS 123, pro forma disclosures are only required in relation to awards granted after
January 1, 1995. Prior to January 1, 2001, Nokia calculated the fair value of the options using the
binomial option-pricing model. From January 1, 2001, the fair value of options has been calculated
using the Black Scholes model. The use of the Black Scholes model rather than the binomial
pricing model did not have a material effect on the compensation expense or on the pro forma net
income or per share amounts disclosed. The fair value of the options is estimated on the date of
grant with the following assumptions:
Weighted average assumptions 2003 2002 2001
Dividend yield .................................................. 2.05% 1.13% 0.93%
Expected volatility ............................................... 35% 50% 50%
Risk-free interest rate ............................................ 2.80% 4.73% 4.05%
Expected life (years) .............................................. 3.6 3.8 2.8
The weighted-average fair value of options granted was EUR 3.48 in 2003, EUR 7.12 in 2002 and
EUR 10.70 in 2001.
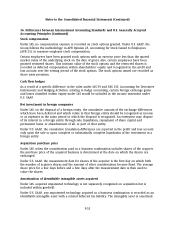
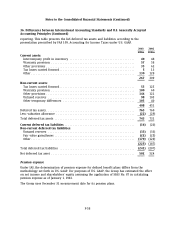
Deferred taxes
Under IAS, the presentation of deferred taxes differs from the methodology set forth in U.S. GAAP.
For purposes of U.S. GAAP, deferred tax assets and liabilities must either be classified as current or
non-current based on the classification of the related non-tax asset or liability for financial
F-57