Nokia 2003 Annual Report Download - page 100
Download and view the complete annual report
Please find page 100 of the 2003 Nokia annual report below. You can navigate through the pages in the report by either clicking on the pages listed below, or by using the keyword search tool below to find specific information within the annual report.-
 1
1 -
2
-
3
-
4
-
5
-
6
-
7
-
8
-
9
-
10
-
11
-
12
-
13
-
14
-
15
-
16
-
17
-
18
-
19
-
20
-
21
-
22
-
23
-
24
-
25
-
26
-
27
-
28
-
29
-
30
-
31
-
32
-
33
-
34
-
35
-
36
-
37
-
38
-
39
-
40
-
41
-
42
-
43
-
44
-
45
-
46
-
47
-
48
-
49
-
50
-
51
-
52
-
53
-
54
-
55
-
56
-
57
-
58
-
59
-
60
-
61
-
62
-
63
-
64
-
65
-
66
-
67
-
68
-
69
-
70
-
71
-
72
-
73
-
74
-
75
-
76
-
77
-
78
-
79
-
80
-
81
-
82
-
83
-
84
-
85
-
86
-
87
-
88
-
89
-
 90
90 -
 91
91 -
 92
92 -
 93
93 -
 94
94 -
 95
95 -
 96
96 -
 97
97 -
 98
98 -
 99
99 -
 100
100 -
 101
101 -
 102
102 -
 103
103 -
 104
104 -
 105
105 -
 106
106 -
 107
107 -
 108
108 -
 109
109 -
 110
110 -
111
-
112
-
113
-
114
-
115
-
116
-
117
-
118
-
119
-
120
-
121
-
122
-
123
-
124
-
125
-
126
-
127
-
128
-
129
-
130
-
131
-
132
-
133
-
134
-
135
-
136
-
137
-
138
-
139
-
140
-
141
-
142
-
143
-
144
-
145
-
146
-
147
-
148
-
149
-
150
-
151
-
152
-
153
-
154
-
155
-
156
-
157
-
158
-
159
-
160
-
161
-
162
-
163
-
164
-
165
-
166
-
167
-
168
-
169
-
170
-
171
-
172
-
173
-
174
 |
 |

31JAN200410095061
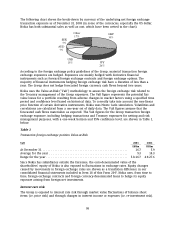
The following chart shows the break-down by currency of the underlying net foreign exchange
transaction exposure as of December 31, 2003 (in some of the currencies, especially the US dollar,
Nokia has both substantial sales as well as cost, which have been netted in the chart).
A
UD
7%
SEK
5%
Other
17%
USD
15% JPY
26%
GBP
30%
According to the foreign exchange policy guidelines of the Group, material transaction foreign
exchange exposures are hedged. Exposures are mainly hedged with derivative financial
instruments such as forward foreign exchange contracts and foreign exchange options. The
majority of financial instruments hedging foreign exchange risk have a duration of less than a
year. The Group does not hedge forecasted foreign currency cash flows beyond two years.
Nokia uses the Value-at-Risk (‘‘VaR’’) methodology to assess the foreign exchange risk related to
the Treasury management of the Group exposures. The VaR figure represents the potential fair
value losses for a portfolio resulting from adverse changes in market factors using a specified time
period and confidence level based on historical data. To correctly take into account the non-linear
price function of certain derivative instruments, Nokia uses Monte Carlo simulation. Volatilities and
correlations are calculated from a one-year set of daily data. The VaR figures assume that the
forecasted cash flows materialize as expected. The VaR figures for the Group transaction foreign
exchange exposure, including hedging transactions and Treasury exposures for netting and risk
management purposes, with a one-week horizon and 95% confidence level, are shown in Table 1,
below.
Table 1
Transaction foreign exchange position Value-at-Risk
VaR 2003 2002
EURm EURm
At December 31 ................................................... 16.7 5.9
Average for the year ............................................... 9.3 14.3
Range for the year ................................................. 5.8-16.7 4.9-27.6
Since Nokia has subsidiaries outside the Eurozone, the euro-denominated value of the
shareholders’ equity of Nokia is also exposed to fluctuations in exchange rates. Equity changes
caused by movements in foreign exchange rates are shown as a translation difference in our
consolidated financial statements included in Item 18 of this Form 20-F. Nokia uses, from time to
time, foreign exchange contracts and foreign currency-denominated loans to hedge its equity
exposure arising from foreign net investments.
Interest rate risk
The Group is exposed to interest rate risk through market value fluctuations of balance sheet
items (i.e. price risk) and through changes in interest income or expenses (i.e. re-investment risk).
99