Nokia 2003 Annual Report Download - page 56
Download and view the complete annual report
Please find page 56 of the 2003 Nokia annual report below. You can navigate through the pages in the report by either clicking on the pages listed below, or by using the keyword search tool below to find specific information within the annual report.-
 1
1 -
2
-
3
-
4
-
5
-
6
-
7
-
8
-
9
-
10
-
11
-
12
-
13
-
14
-
15
-
16
-
17
-
18
-
19
-
20
-
21
-
22
-
23
-
24
-
25
-
26
-
27
-
28
-
29
-
30
-
31
-
32
-
33
-
34
-
35
-
36
-
37
-
38
-
39
-
40
-
41
-
42
-
43
-
44
-
45
-
 46
46 -
 47
47 -
 48
48 -
 49
49 -
 50
50 -
 51
51 -
 52
52 -
 53
53 -
 54
54 -
 55
55 -
 56
56 -
 57
57 -
 58
58 -
 59
59 -
 60
60 -
 61
61 -
 62
62 -
 63
63 -
 64
64 -
 65
65 -
 66
66 -
67
-
68
-
69
-
70
-
71
-
72
-
73
-
74
-
75
-
76
-
77
-
78
-
79
-
80
-
81
-
82
-
83
-
84
-
85
-
86
-
87
-
88
-
89
-
90
-
91
-
92
-
93
-
94
-
95
-
96
-
97
-
98
-
99
-
100
-
101
-
102
-
103
-
104
-
105
-
106
-
107
-
108
-
109
-
110
-
111
-
112
-
113
-
114
-
115
-
116
-
117
-
118
-
119
-
120
-
121
-
122
-
123
-
124
-
125
-
126
-
127
-
128
-
129
-
130
-
131
-
132
-
133
-
134
-
135
-
136
-
137
-
138
-
139
-
140
-
141
-
142
-
143
-
144
-
145
-
146
-
147
-
148
-
149
-
150
-
151
-
152
-
153
-
154
-
155
-
156
-
157
-
158
-
159
-
160
-
161
-
162
-
163
-
164
-
165
-
166
-
167
-
168
-
169
-
170
-
171
-
172
-
173
-
174
 |
 |
During the second half of 2003 the market began to show signs of improvement. Enterprises
continued to rank spending on corporate network security as among their highest priorities, with
positive effects on overall market growth in 2003. Sales at Nokia Internet Communications were
slightly lower in 2003, reflecting the continued weakness of the US dollar. During 2003, Nokia
Home Communications continued renewing and broadening its product portfolio. However, the
market for digital set top boxes developed slower than expected leading in decrease in sales
compared to 2002.
Common Group Expenses—This line item, which comprises Nokia Head Office, Nokia Research
Center and other general functions’ operating losses, totaled EUR 92 million in 2003, compared to
EUR 231 million in 2002. In 2003, this included a gain of EUR 56 million from the sale of the
remaining shares of Nokian Tyres. During 2002, the company’s investment in certain equity
securities suffered a permanent decline in value resulting in an impairment of available-for-sale
investments of EUR 55 million.
Net Financial Income
Net interest and other financial income totaled EUR 352 million in 2003 compared to
EUR 156 million in 2002. Net financial income in 2003 resulted from a continued strong cash
position reflected in the negative net debt to equity ratio of -71% at December 31, 2003, compared
to a net debt to equity ratio of -61% at December 31, 2002. See ‘‘—Exchange Rates’’ below. At
year-end 2003, we had cash and cash equivalents of EUR 11 296 million compared to EUR 9
351 million at year-end 2002.
Profit Before Taxes
Profit before taxes and minority interests increased 9% and totaled EUR 5 345 million in 2003
compared to EUR 4 917 million in 2002. Taxes amounted to EUR 1 699 million and
EUR 1 484 million in 2003 and 2002, respectively.
Minority Interests
Minority shareholders’ interest in our subsidiaries’ profits totaled EUR 54 million in 2003 compared
to EUR 52 million in 2002.
Net Profit and Earnings per Share
Net profit in 2003 increased to EUR 3 592 million, compared to EUR 3 381 million in 2002,
representing a year-on-year increase in net profit of 6% in 2003. Basic earnings per share
increased to EUR 0.75 in 2003 compared to EUR 0.71 in 2002.
2002 compared to 2001
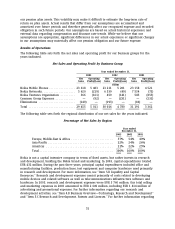
Nokia Net Sales and Operating Profit
The year 2002 was characterized by intense competition and a continued weakened global
economy. Our net sales totaled EUR 30 016 million in 2002 and EUR 31 191 million in 2001,
representing a decrease in net sales of 4% in 2002. This mainly reflected continuing difficult
operating conditions in our network infrastructure business. Our gross margin in 2002 improved
to 39.1% compared to 36.6% in 2001, reflecting primarily a decrease in product costs in Nokia
Mobile Phones. Our operating profit increased by 42% to EUR 4 780 million in 2002, compared to
EUR 3 362 million in 2001. Our operating margin was 15.9% in 2002, compared to 10.8% in 2001.
We continued to invest significantly in research and development. Research and development
expenses totaled EUR 3 052 million in 2002, an increase of 2% from 2001 (EUR 2 985 million).
Research and development expenses represented 10.2% of net sales in 2002 compared to 9.6% of
net sales in 2001.
55