Nokia 2003 Annual Report Download - page 115
Download and view the complete annual report
Please find page 115 of the 2003 Nokia annual report below. You can navigate through the pages in the report by either clicking on the pages listed below, or by using the keyword search tool below to find specific information within the annual report.-
 1
1 -
2
-
3
-
4
-
5
-
6
-
7
-
8
-
9
-
10
-
11
-
12
-
13
-
14
-
15
-
16
-
17
-
18
-
19
-
20
-
21
-
22
-
23
-
24
-
25
-
26
-
27
-
28
-
29
-
30
-
31
-
32
-
33
-
34
-
35
-
36
-
37
-
38
-
39
-
40
-
41
-
42
-
43
-
44
-
45
-
46
-
47
-
48
-
49
-
50
-
51
-
52
-
53
-
54
-
55
-
56
-
57
-
58
-
59
-
60
-
61
-
62
-
63
-
64
-
65
-
66
-
67
-
68
-
69
-
70
-
71
-
72
-
73
-
74
-
75
-
76
-
77
-
78
-
79
-
80
-
81
-
82
-
83
-
84
-
85
-
86
-
87
-
88
-
89
-
90
-
91
-
92
-
93
-
94
-
95
-
96
-
97
-
98
-
99
-
100
-
101
-
102
-
103
-
104
-
 105
105 -
 106
106 -
 107
107 -
 108
108 -
 109
109 -
 110
110 -
 111
111 -
 112
112 -
 113
113 -
 114
114 -
 115
115 -
 116
116 -
 117
117 -
 118
118 -
 119
119 -
 120
120 -
 121
121 -
 122
122 -
 123
123 -
 124
124 -
 125
125 -
126
-
127
-
128
-
129
-
130
-
131
-
132
-
133
-
134
-
135
-
136
-
137
-
138
-
139
-
140
-
141
-
142
-
143
-
144
-
145
-
146
-
147
-
148
-
149
-
150
-
151
-
152
-
153
-
154
-
155
-
156
-
157
-
158
-
159
-
160
-
161
-
162
-
163
-
164
-
165
-
166
-
167
-
168
-
169
-
170
-
171
-
172
-
173
-
174
 |
 |

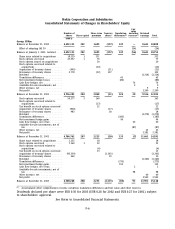
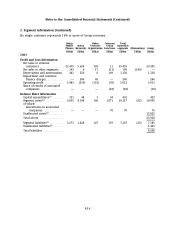
Nokia Corporation and Subsidiaries
Consolidated Statements of Changes in Shareholders’ Equity
Fair
value
Number of Share issue Treasury Translation and other Retained
shares Share capital premium shares differences(1) reserves(1) earnings Total
(000’s)
Group, EURm
Balance at December 31, 2000 ........ 4,692,133 282 1,695 (157) 347 — 8,641 10,808
Effect of adopting IAS 39 .......... (56) (56)
Balance at January 1, 2001, restated .... 4,692,133 282 1,695 (157) 347 (56) 8,641 10,752
Share issue related to acquisitions .... 18,329 1 331 332
Stock options exercised ........... 23,057 1 76 77
Stock options issued on acquisitions . . 20 20
Stock options exercised related to
acquisitions .................. (10) (10)
Acquisition of treasury shares ....... (995) (21) (21)
Reissuance of treasury shares ....... 3,778 (52) 157 105
Dividend ..................... (1,314) (1,314)
Translation differences ............ 65 65
Net investment hedge losses ........ (86) (86)
Cash flow hedges, net ............ 76 76
Available-for-sale investments, net .... 0 0
Other increase, net .............. 99
Net profit ..................... 2,200 2,200
Balance at December 31, 2001 ........ 4,736,302 284 2,060 (21) 326 20 9,536 12,205
Stock options exercised ........... 50,377 3 160 163
Stock options exercised related to
acquisitions .................. (17) (17)
Tax benefit on stock options exercised . 22 22
Acquisition of treasury shares ....... (900) (17) (17)
Reissuance of treasury shares ....... 983 18 18
Dividend ..................... (1,279) (1,279)
Translation differences ............ (285) (285)
Net investment hedge gains ........ 94 94
Cash flow hedges, net of tax ........ 60 60
Available-for-sale investments, net of
tax........................ (87) (87)
Other increase, net .............. 23 23
Net profit ..................... 3,381 3,381
Balance at December 31, 2002 ........ 4,786,762 287 2,225 (20) 135 (7) 11,661 14,281
Share issue related to acquisitions .... 1,225 18 18
Stock options exercised ........... 7,160 1 22 23
Stock options exercised related to
acquisitions .................. (6) (6)
Tax benefit on stock options exercised . 13 13
Acquisition of treasury shares ....... (95,339) (1,363) (1,363)
Reissuance of treasury shares ....... 460 10 10
Dividend ..................... (1,340) (1,340)
Translation differences ............ (375) (375)
Net investment hedge gains ........ 155 155
Cash flow hedges, net of tax ........ 2 2
Available-for-sale investments, net of
tax........................ 98 98
Other increase, net .............. 40 40
Net profit ..................... 3,592 3,592
Balance at December 31, 2003 ........ 4,700,268 288 2,272 (1,373) (85) 93 13,953 15,148
(1) Accumulated other comprehensive income comprises translation differences and fair value and other reserves.
Dividends declared per share were EUR 0.30 for 2003 (EUR 0.28 for 2002 and EUR 0.27 for 2001), subject
to shareholders’ approval.
See Notes to Consolidated Financial Statements.
F-6