Nokia 2003 Annual Report Download - page 153
Download and view the complete annual report
Please find page 153 of the 2003 Nokia annual report below. You can navigate through the pages in the report by either clicking on the pages listed below, or by using the keyword search tool below to find specific information within the annual report.-
 1
1 -
2
-
3
-
4
-
5
-
6
-
7
-
8
-
9
-
10
-
11
-
12
-
13
-
14
-
15
-
16
-
17
-
18
-
19
-
20
-
21
-
22
-
23
-
24
-
25
-
26
-
27
-
28
-
29
-
30
-
31
-
32
-
33
-
34
-
35
-
36
-
37
-
38
-
39
-
40
-
41
-
42
-
43
-
44
-
45
-
46
-
47
-
48
-
49
-
50
-
51
-
52
-
53
-
54
-
55
-
56
-
57
-
58
-
59
-
60
-
61
-
62
-
63
-
64
-
65
-
66
-
67
-
68
-
69
-
70
-
71
-
72
-
73
-
74
-
75
-
76
-
77
-
78
-
79
-
80
-
81
-
82
-
83
-
84
-
85
-
86
-
87
-
88
-
89
-
90
-
91
-
92
-
93
-
94
-
95
-
96
-
97
-
98
-
99
-
100
-
101
-
102
-
103
-
104
-
105
-
106
-
107
-
108
-
109
-
110
-
111
-
112
-
113
-
114
-
115
-
116
-
117
-
118
-
119
-
120
-
121
-
122
-
123
-
124
-
125
-
126
-
127
-
128
-
129
-
130
-
131
-
132
-
133
-
134
-
135
-
136
-
137
-
138
-
139
-
140
-
141
-
142
-
 143
143 -
 144
144 -
 145
145 -
 146
146 -
 147
147 -
 148
148 -
 149
149 -
 150
150 -
 151
151 -
 152
152 -
 153
153 -
 154
154 -
 155
155 -
 156
156 -
 157
157 -
 158
158 -
 159
159 -
 160
160 -
 161
161 -
 162
162 -
 163
163 -
164
-
165
-
166
-
167
-
168
-
169
-
170
-
171
-
172
-
173
-
174
 |
 |

Notes to the Consolidated Financial Statements (Continued)
34. Risk management (Continued)
Nokia uses the VaR methodology to assess and measure the interest rate risk in the investment
portfolio, which is benchmarked against a one-year investment horizon. The VaR figure represents
the potential fair value losses for a portfolio resulting from adverse changes in market factors
using a specified time period and confidence level based on historical data. For interest rate risk
VaR, Nokia uses variance-covariance methodology. Volatilities and correlations are calculated from
a one-year set of daily data.
Equity price risk
Nokia has certain strategic minority investments in publicly traded companies. These investments
are classified as available-for-sale. The fair value of the equity investments at December 31, 2003
was EUR 8 million (EUR 137 million in 2002).
There are currently no outstanding derivative financial instruments designated as hedges of these
equity investments.
In addition to the listed equity holdings, Nokia invests in private equity through Nokia Venture
Funds. The fair value of these available-for-sale equity investments at December 31, 2003 was
USD 85 million (USD 54 million in 2002). Nokia is exposed to equity price risk on social security
costs relating to stock compensation plans. Nokia hedges this risk by entering into cash settled
equity swap and option contracts.
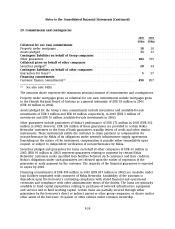
b) Credit risk
Customer Finance Credit Risk
Network operators in some markets sometimes require their suppliers to arrange or provide term
financing in relation to infrastructure projects. Nokia has maintained a financing policy aimed at
close cooperation with banks, financial institutions and Export Credit Agencies to support selected
customers in their financing of infrastructure investments. Nokia actively mitigates, market
conditions permitting, this exposure by arrangements with these institutions and investors.
Credit risks related to customer financing are systematically analyzed, monitored and managed by
Nokia’s Customer Finance organization, reporting to the Chief Financial Officer. Credit risks are
approved and monitored by Nokia’s Credit Committee along principles defined in the Company’s
credit policy and according to the credit approval process. The Credit Committee consists of the
CFO, Group Controller, Head of Group Treasury and Head of Nokia Customer Finance.
At the end of December 31, 2003 our long-term loans to customers, net of allowances and
write-offs, totaled EUR 354 million (EUR 1,056 million in 2002), while financial guarantees given
on behalf of third parties totaled EUR 33 million (EUR 91 million in 2002). In addition, we had
financing commitments totaling EUR 490 million (EUR 857 million in 2002). Total customer
financing (outstanding and committed) stood at EUR 877 million (EUR 2,004 million in 2002).
The term customer financing portfolio at December 31, 2003 was:
Financing
Outstanding Commitments Totals
EURm EURm EURm
Total Portfolio ........................................ 387 490 877
F-44