Nokia 2003 Annual Report Download - page 127
Download and view the complete annual report
Please find page 127 of the 2003 Nokia annual report below. You can navigate through the pages in the report by either clicking on the pages listed below, or by using the keyword search tool below to find specific information within the annual report.-
 1
1 -
2
-
3
-
4
-
5
-
6
-
7
-
8
-
9
-
10
-
11
-
12
-
13
-
14
-
15
-
16
-
17
-
18
-
19
-
20
-
21
-
22
-
23
-
24
-
25
-
26
-
27
-
28
-
29
-
30
-
31
-
32
-
33
-
34
-
35
-
36
-
37
-
38
-
39
-
40
-
41
-
42
-
43
-
44
-
45
-
46
-
47
-
48
-
49
-
50
-
51
-
52
-
53
-
54
-
55
-
56
-
57
-
58
-
59
-
60
-
61
-
62
-
63
-
64
-
65
-
66
-
67
-
68
-
69
-
70
-
71
-
72
-
73
-
74
-
75
-
76
-
77
-
78
-
79
-
80
-
81
-
82
-
83
-
84
-
85
-
86
-
87
-
88
-
89
-
90
-
91
-
92
-
93
-
94
-
95
-
96
-
97
-
98
-
99
-
100
-
101
-
102
-
103
-
104
-
105
-
106
-
107
-
108
-
109
-
110
-
111
-
112
-
113
-
114
-
115
-
116
-
 117
117 -
 118
118 -
 119
119 -
 120
120 -
 121
121 -
 122
122 -
 123
123 -
 124
124 -
 125
125 -
 126
126 -
 127
127 -
 128
128 -
 129
129 -
 130
130 -
 131
131 -
 132
132 -
 133
133 -
 134
134 -
 135
135 -
 136
136 -
 137
137 -
138
-
139
-
140
-
141
-
142
-
143
-
144
-
145
-
146
-
147
-
148
-
149
-
150
-
151
-
152
-
153
-
154
-
155
-
156
-
157
-
158
-
159
-
160
-
161
-
162
-
163
-
164
-
165
-
166
-
167
-
168
-
169
-
170
-
171
-
172
-
173
-
174
 |
 |

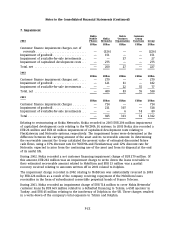
Notes to the Consolidated Financial Statements (Continued)
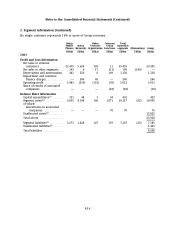
2. Segment information (Continued)
(3) Unallocated assets including prepaid expenses and accrued income related to taxes and deferred
tax assets (EUR 834 million in 2003 and EUR 853 million in 2002).
(4) Comprises accounts payable, deferred income, accrued expenses and provisions except those related
to interest and taxes.
(5) Unallocated liabilities including prepaid income and accrued expenses related to taxes and deferred
tax liabilities (EUR 394 million in 2003 and EUR 248 million in 2002).
2003 2002 2001
EURm EURm EURm
Net sales to external customers by geographic area by location of
customer
Finland .................................................... 347 353 453
USA....................................................... 4,475 4,665 5,614
Great Britain ................................................ 2,693 3,111 2,808
Germany ................................................... 2,297 1,849 2,003
China ..................................................... 2,013 2,802 3,418
Other ...................................................... 17,630 17,236 16,895
Total ...................................................... 29,455 30,016 31,191
2003 2002
EURm EURm
Segment assets by geographic area
Finland .................................................... 4,215 4,913
USA....................................................... 1,563 1,777
Great Britain ................................................ 344 627
Germany ................................................... 387 431
China ..................................................... 1,011 1,107
Other ...................................................... 2,575 3,249
Total ...................................................... 10,095 12,104
2003 2002 2001
EURm EURm EURm
Capital expenditures by market area
Finland .................................................... 160 188 477
USA(1) ..................................................... 49 71 151
Great Britain ................................................ 927 34
Germany ................................................... 17 21 37
China ..................................................... 53 47 131
Other(1) .................................................... 144 78 211
Total ...................................................... 432 432 1,041
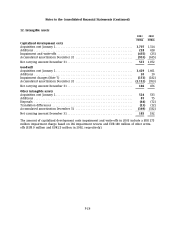
(1) Including goodwill and capitalized development costs, capital expenditures amount to
EUR 670 million in 2003 (EUR 860 million in 2002 and EUR 2,064 million in 2001). The goodwill
and capitalized development costs consist of EUR 20 million in USA in 2003 (EUR 1 million in
USA in 2002 and EUR 582 million in 2001) and EUR 218 million in other areas in 2003
(EUR 427 million in 2002 and EUR 441 million in 2001).
F-18