Nokia 2003 Annual Report Download - page 47
Download and view the complete annual report
Please find page 47 of the 2003 Nokia annual report below. You can navigate through the pages in the report by either clicking on the pages listed below, or by using the keyword search tool below to find specific information within the annual report.-
 1
1 -
2
-
3
-
4
-
5
-
6
-
7
-
8
-
9
-
10
-
11
-
12
-
13
-
14
-
15
-
16
-
17
-
18
-
19
-
20
-
21
-
22
-
23
-
24
-
25
-
26
-
27
-
28
-
29
-
30
-
31
-
32
-
33
-
34
-
35
-
36
-
 37
37 -
 38
38 -
 39
39 -
 40
40 -
 41
41 -
 42
42 -
 43
43 -
 44
44 -
 45
45 -
 46
46 -
 47
47 -
 48
48 -
 49
49 -
 50
50 -
 51
51 -
 52
52 -
 53
53 -
 54
54 -
 55
55 -
 56
56 -
 57
57 -
58
-
59
-
60
-
61
-
62
-
63
-
64
-
65
-
66
-
67
-
68
-
69
-
70
-
71
-
72
-
73
-
74
-
75
-
76
-
77
-
78
-
79
-
80
-
81
-
82
-
83
-
84
-
85
-
86
-
87
-
88
-
89
-
90
-
91
-
92
-
93
-
94
-
95
-
96
-
97
-
98
-
99
-
100
-
101
-
102
-
103
-
104
-
105
-
106
-
107
-
108
-
109
-
110
-
111
-
112
-
113
-
114
-
115
-
116
-
117
-
118
-
119
-
120
-
121
-
122
-
123
-
124
-
125
-
126
-
127
-
128
-
129
-
130
-
131
-
132
-
133
-
134
-
135
-
136
-
137
-
138
-
139
-
140
-
141
-
142
-
143
-
144
-
145
-
146
-
147
-
148
-
149
-
150
-
151
-
152
-
153
-
154
-
155
-
156
-
157
-
158
-
159
-
160
-
161
-
162
-
163
-
164
-
165
-
166
-
167
-
168
-
169
-
170
-
171
-
172
-
173
-
174
 |
 |
ITEM 5. OPERATING AND FINANCIAL REVIEW AND PROSPECTS
5.A Operating Results
Until January 1, 2004, Nokia’s organizational and reporting structure consisted of two main
business groups, Nokia Mobile Phones and Nokia Networks, as well as the company’s venturing
arm, Nokia Ventures Organization, and the common group functions. Towards the end of 2003,
Nokia took the decision, effective January 1, 2004, to reorganize its structure in a move to further
align the company’s overall structure with its strategy. Nokia’s new structure includes four
business groups, which form the main reporting structure: Mobile Phones; Multimedia; Networks;
and Enterprise Solutions, which provide us with a strong organizational base to make progress in
the mobility industry and which also build on the changes that were first implemented within the
Nokia Mobile Phones in 2002.
The new structure also includes three horizontal groups that service and support the business
groups: Customer and Market Operations; Technology Platforms; and Research, Venturing and
Business Infrastructure. The horizontal groups will not be separate reporting entities, but their
costs will be carried mainly by the business groups and some included in the Common Group
Expenses. Within the new structure, we believe that each of the four business groups is positioned
to meet the specific need of diverse market segments, while the horizontal groups are designed to
increase Nokia’s operational efficiency and competitiveness and to maintain our strong economies
of scale.
The following discussion and analysis by management of our operating and financial results is
based upon our organizational and reporting structure until the end of 2003, and should be read
in conjunction with our consolidated financial statements included in Item 18 of this Form 20-F.
Our consolidated financial statements and the financial information discussed below have been
prepared in accordance with IAS. For a discussion of the principal differences between IAS and US
GAAP, see ‘‘—Principal Differences between IAS and US GAAP’’ below and Note 36 to our
consolidated financial statements.
Business segment data in the following discussion and analysis is prior to inter-segment
eliminations. See Note 2 to our consolidated financial statements.
Introduction
At Nokia, one of our top priorities is to continue to strengthen our leading market position in a
profitable way. We believe that further market share gains and further market growth are
important to expanding our customer base and growing our future business potential. Our leading
position enhances the positive effects of our economies of scale, which we believe should
strengthen our competitive position in the mobility industry. We have invested significantly in
research and development, introducing new products and creating increased consumer recognition
of the Nokia brand. We currently have manufacturing facilities and research and development
centers in each of our three geographical regions, and we supply our products in over 130
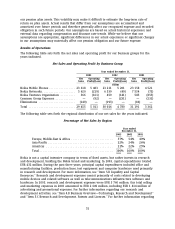
countries worldwide. In 2003, 57% of our net sales originated from Europe, Middle-East & Africa,
22% from Asia-Pacific and 21% from the Americas. Based on sales, the ten largest markets in 2003
were the United States, the United Kingdom, Germany, China, United Arab Emirates, India, Italy,
France, Brazil and Spain, representing 61% of total sales.
For further information regarding our business and operations please see ‘‘Item 4 Information on
the Company.’’
46